29
/
en
AIzaSyAYiBZKx7MnpbEhh9jyipgxe19OcubqV5w
April 1, 2024
222487
Peru
PER
true
2
1
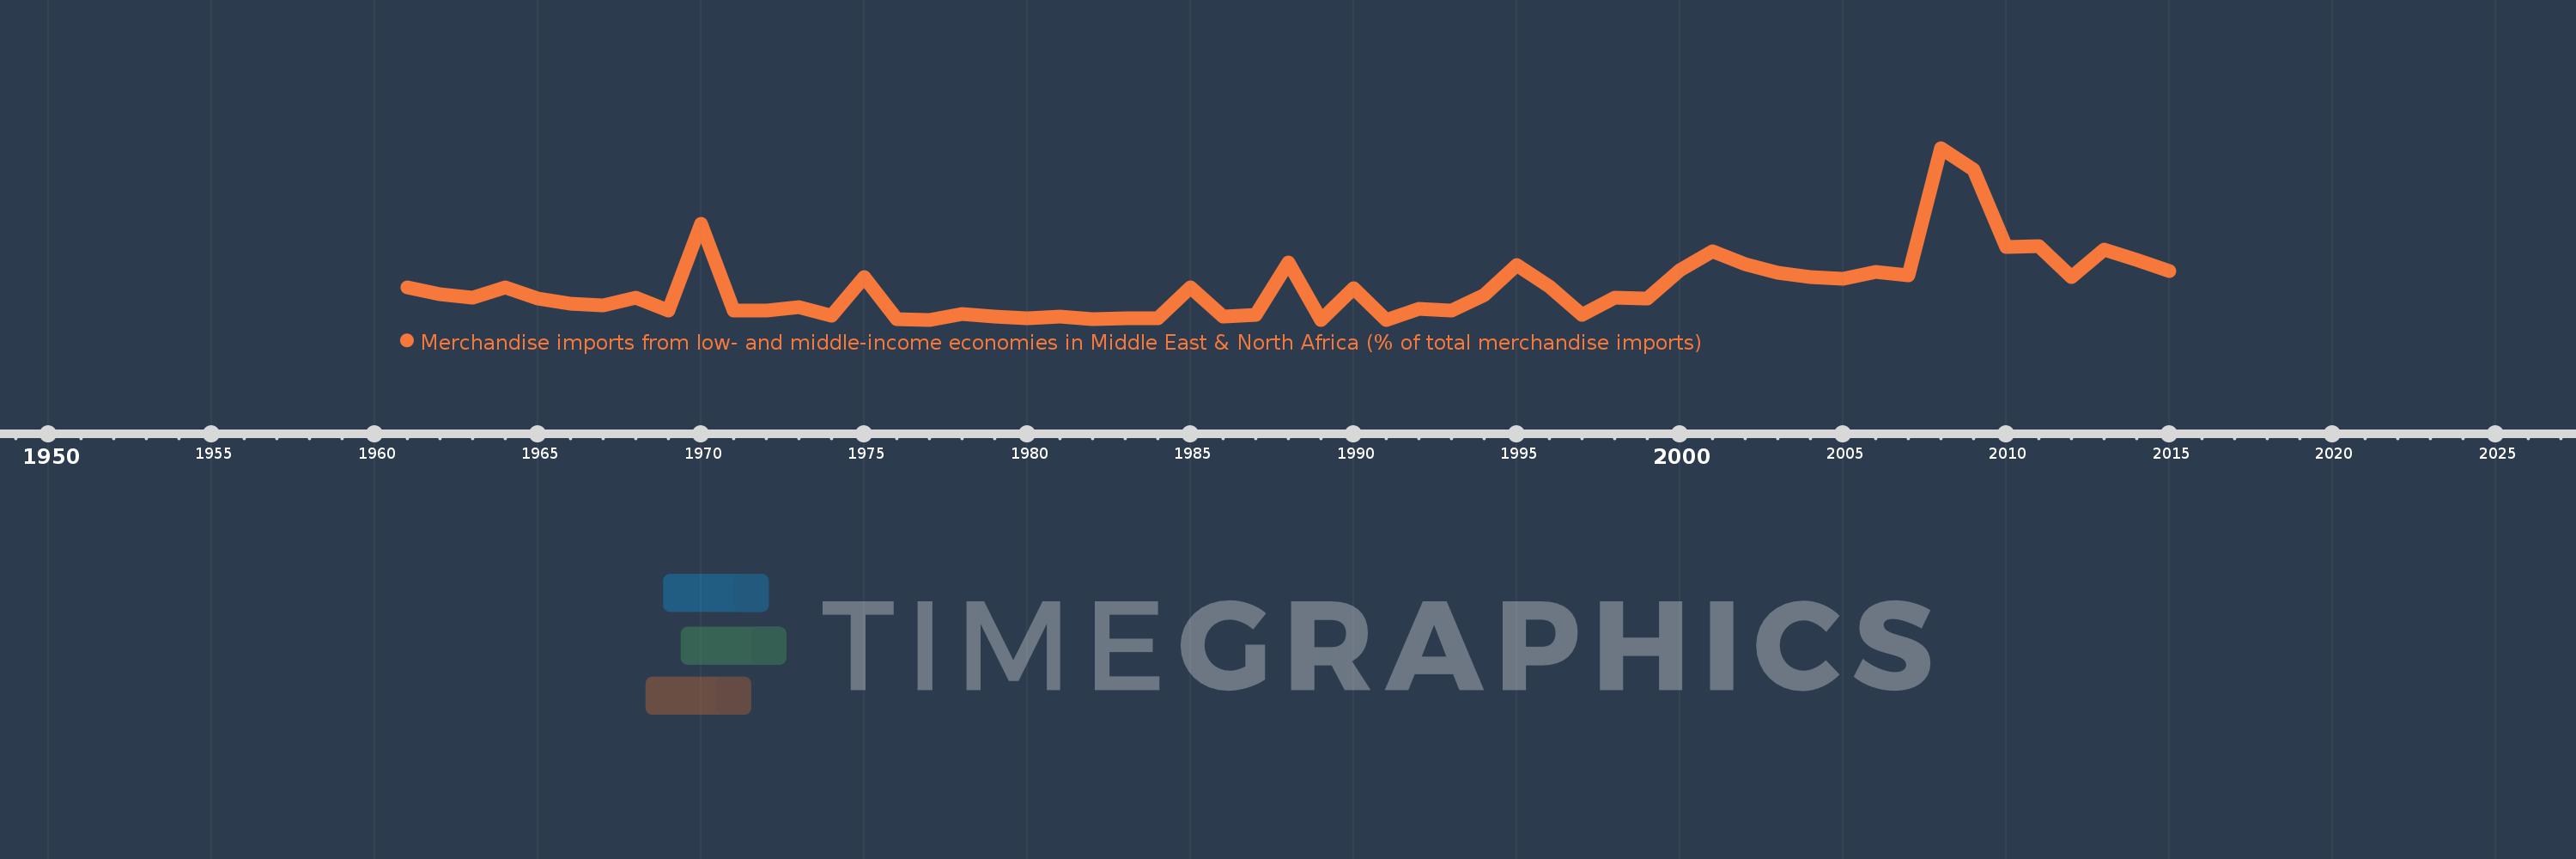
Merchandise imports from low- and middle-income economies in Middle East & North Africa (% of total merchandise imports)
2015,2014,2013,2012,2011,2010,2009,2008,2007,2006,2005,2004,2003,2002,2001,2000,1999,1998,1997,1996,1995,1994,1993,1992,1991,1990,1989,1988,1987,1986,1985,1984,1983,1982,1981,1980,1979,1978,1977,1976,1975,1974,1973,1972,1971,1970,1969,1968,1967,1966,1965,1964,1963,1962,1961
Global statistics library →Peru →Merchandise imports from low- and middle-income economies in Middle East & North Africa (% of total merchandise imports)
This statistics in other country:
AfghanistanAlbaniaAlgeriaAngolaArab WorldArgentinaArmeniaArubaAustraliaAustriaAzerbaijanBahamas, TheBahrainBangladeshBarbadosBelarusBelgiumBelizeBeninBermudaBoliviaBosnia and HerzegovinaBrazilBrunei DarussalamBulgariaBurkina FasoBurundiCabo VerdeCambodiaCameroonCanadaCaribbean small statesCentral African RepublicCentral Europe and the BalticsChadChileChinaColombiaComorosCongo, Dem. Rep.Congo, Rep.Costa RicaCote d'IvoireCroatiaCubaCyprusCzech RepublicDenmarkDjiboutiDominicaDominican RepublicEarly-demographic dividendEast Asia & PacificEast Asia & Pacific (excluding high income)East Asia & Pacific (IDA & IBRD countries)EcuadorEgypt, Arab Rep.El SalvadorEstoniaEthiopiaEuro areaEurope & Central AsiaEurope & Central Asia (excluding high income)Europe & Central Asia (IDA & IBRD countries)European UnionFijiFinlandFragile and conflict affected situationsFranceFrench PolynesiaGabonGambia, TheGeorgiaGermanyGhanaGreeceGreenlandGrenadaGuatemalaGuineaGuinea-BissauGuyanaHaitiHeavily indebted poor countries (HIPC)High incomeHondurasHong Kong SAR, ChinaHungaryIBRD onlyIcelandIDA & IBRD totalIDA blendIDA onlyIDA totalIndiaIndonesiaIran, Islamic Rep.IraqIrelandIsraelItalyJamaicaJapanJordanKazakhstanKenyaKorea, Dem. People’s Rep.Korea, Rep.KosovoKuwaitKyrgyz RepublicLao PDRLate-demographic dividendLatin America & Caribbean Latin America & Caribbean (excluding high income)Latin America & the Caribbean (IDA & IBRD countries)LatviaLeast developed countries: UN classificationLebanonLiberiaLibyaLithuaniaLow & middle incomeLow incomeLower middle incomeLuxembourgMacao SAR, ChinaMacedonia, FYRMadagascarMalawiMalaysiaMaldivesMaliMaltaMauritaniaMauritiusMexicoMiddle East & North AfricaMiddle East & North Africa (excluding high income)Middle East & North Africa (IDA & IBRD countries)Middle incomeMoldovaMongoliaMontenegroMoroccoMozambiqueMyanmarNepalNetherlandsNew CaledoniaNew ZealandNicaraguaNigerNigeriaNorth AmericaNorwayOECD membersOmanOther small statesPacific island small statesPakistanPanamaPapua New GuineaParaguayPeruPhilippinesPolandPortugalPost-demographic dividendPre-demographic dividendQatarRomaniaRussian FederationRwandaSamoaSaudi ArabiaSenegalSerbiaSeychellesSierra LeoneSingaporeSlovak RepublicSloveniaSmall statesSomaliaSouth AfricaSouth AsiaSouth Asia (IDA & IBRD)SpainSri LankaSt. Kitts and NevisSt. LuciaSt. Vincent and the GrenadinesSub-Saharan Africa Sub-Saharan Africa (excluding high income)Sub-Saharan Africa (IDA & IBRD countries)SudanSurinameSwedenSwitzerlandSyrian Arab RepublicTajikistanTanzaniaThailandTogoTrinidad and TobagoTunisiaTurkeyTurkmenistanUgandaUkraineUnited Arab EmiratesUnited KingdomUnited StatesUpper middle incomeUruguayUzbekistanVenezuela, RBVietnamWorldYemen, Rep.ZambiaZimbabwe Timeline:
This timeline shows a graph from 1961 to 2015 of Peru. No data until 1960. Number of actual observations by date: 55.
Source name:
World Development Indicators
Source organization:
World Bank staff estimates based data from International Monetary Fund's Direction of Trade database.
Categories, topics:
Private Sector, Trade
Last updated:
apr 23, 2017
Indicators value changes by year
At the date of observation
Value
Absolute change
Change from previous value
jan 1, 1961
0.054
+0.054
0.0%
jan 1, 1962
0.043
-0.011
-20.4%
jan 1, 1963
0.037
-0.005
-12.69%
jan 1, 1964
0.054
+0.017
44.56%
jan 1, 1965
0.035
-0.019
-35.86%
jan 1, 1966
0.027
-0.007
-20.59%
jan 1, 1967
0.024
-0.003
-10.81%
jan 1, 1968
0.037
+0.012
50.7%
jan 1, 1969
0.016
-0.021
-56.97%
jan 1, 1970
0.161
+0.145
915.67%
jan 1, 1971
0.015
-0.147
-90.98%
jan 1, 1972
0.016
+0.001
9.63%
jan 1, 1973
0.021
+0.005
33.68%
jan 1, 1974
0.007
-0.014
-67.98%
jan 1, 1975
0.071
+0.064
942.83%
jan 1, 1976
0.001
-0.07
-98.26%
jan 1, 1977
0.0
-0.001
-100.0%
jan 1, 1979
0.006
-0.003
-34.45%
jan 1, 1980
0.003
-0.003
-48.89%
jan 1, 1981
0.005
+0.001
39.75%
jan 1, 1982
0.001
-0.003
-76.61%
jan 1, 1983
0.002
+0.001
100.23%
jan 1, 1984
0.002
+0.0
5.35%
jan 1, 1985
0.054
+0.051
2.3K%
jan 1, 1986
0.005
-0.048
-90.47%
jan 1, 1987
0.008
+0.003
53.35%
jan 1, 1988
0.095
+0.087
1.11K%
jan 1, 1989
0.0
-0.095
-100.0%
jan 1, 1990
0.052
+0.052
%
jan 1, 1991
0.0
-0.052
-100.0%
jan 1, 1992
0.018
+0.018
%
jan 1, 1993
0.016
-0.003
-13.78%
jan 1, 1994
0.041
+0.025
158.6%
jan 1, 1995
0.092
+0.051
125.35%
jan 1, 1996
0.056
-0.036
-39.04%
jan 1, 1997
0.008
-0.048
-85.23%
jan 1, 1998
0.037
+0.029
354.14%
jan 1, 1999
0.036
-0.002
-4.23%
jan 1, 2000
0.083
+0.047
130.78%
jan 1, 2001
0.115
+0.033
39.45%
jan 1, 2002
0.093
-0.022
-19.31%
jan 1, 2003
0.078
-0.015
-16.09%
jan 1, 2004
0.071
-0.007
-9.05%
jan 1, 2005
0.069
-0.002
-3.02%
jan 1, 2006
0.08
+0.011
15.51%
jan 1, 2007
0.074
-0.005
-6.81%
jan 1, 2008
0.287
+0.213
286.99%
jan 1, 2009
0.25
-0.037
-12.84%
jan 1, 2010
0.122
-0.128
-51.34%
jan 1, 2011
0.123
+0.002
1.37%
jan 1, 2012
0.071
-0.053
-42.69%
jan 1, 2013
0.117
+0.046
65.54%
jan 1, 2014
0.1
-0.017
-14.55%
jan 1, 2015
0.081
-0.019
-18.75%
Ranking of countries by current statistics by years


Comments: