29
/
en
AIzaSyAYiBZKx7MnpbEhh9jyipgxe19OcubqV5w
April 1, 2024
140683
Ghana
GHA
true
2
1
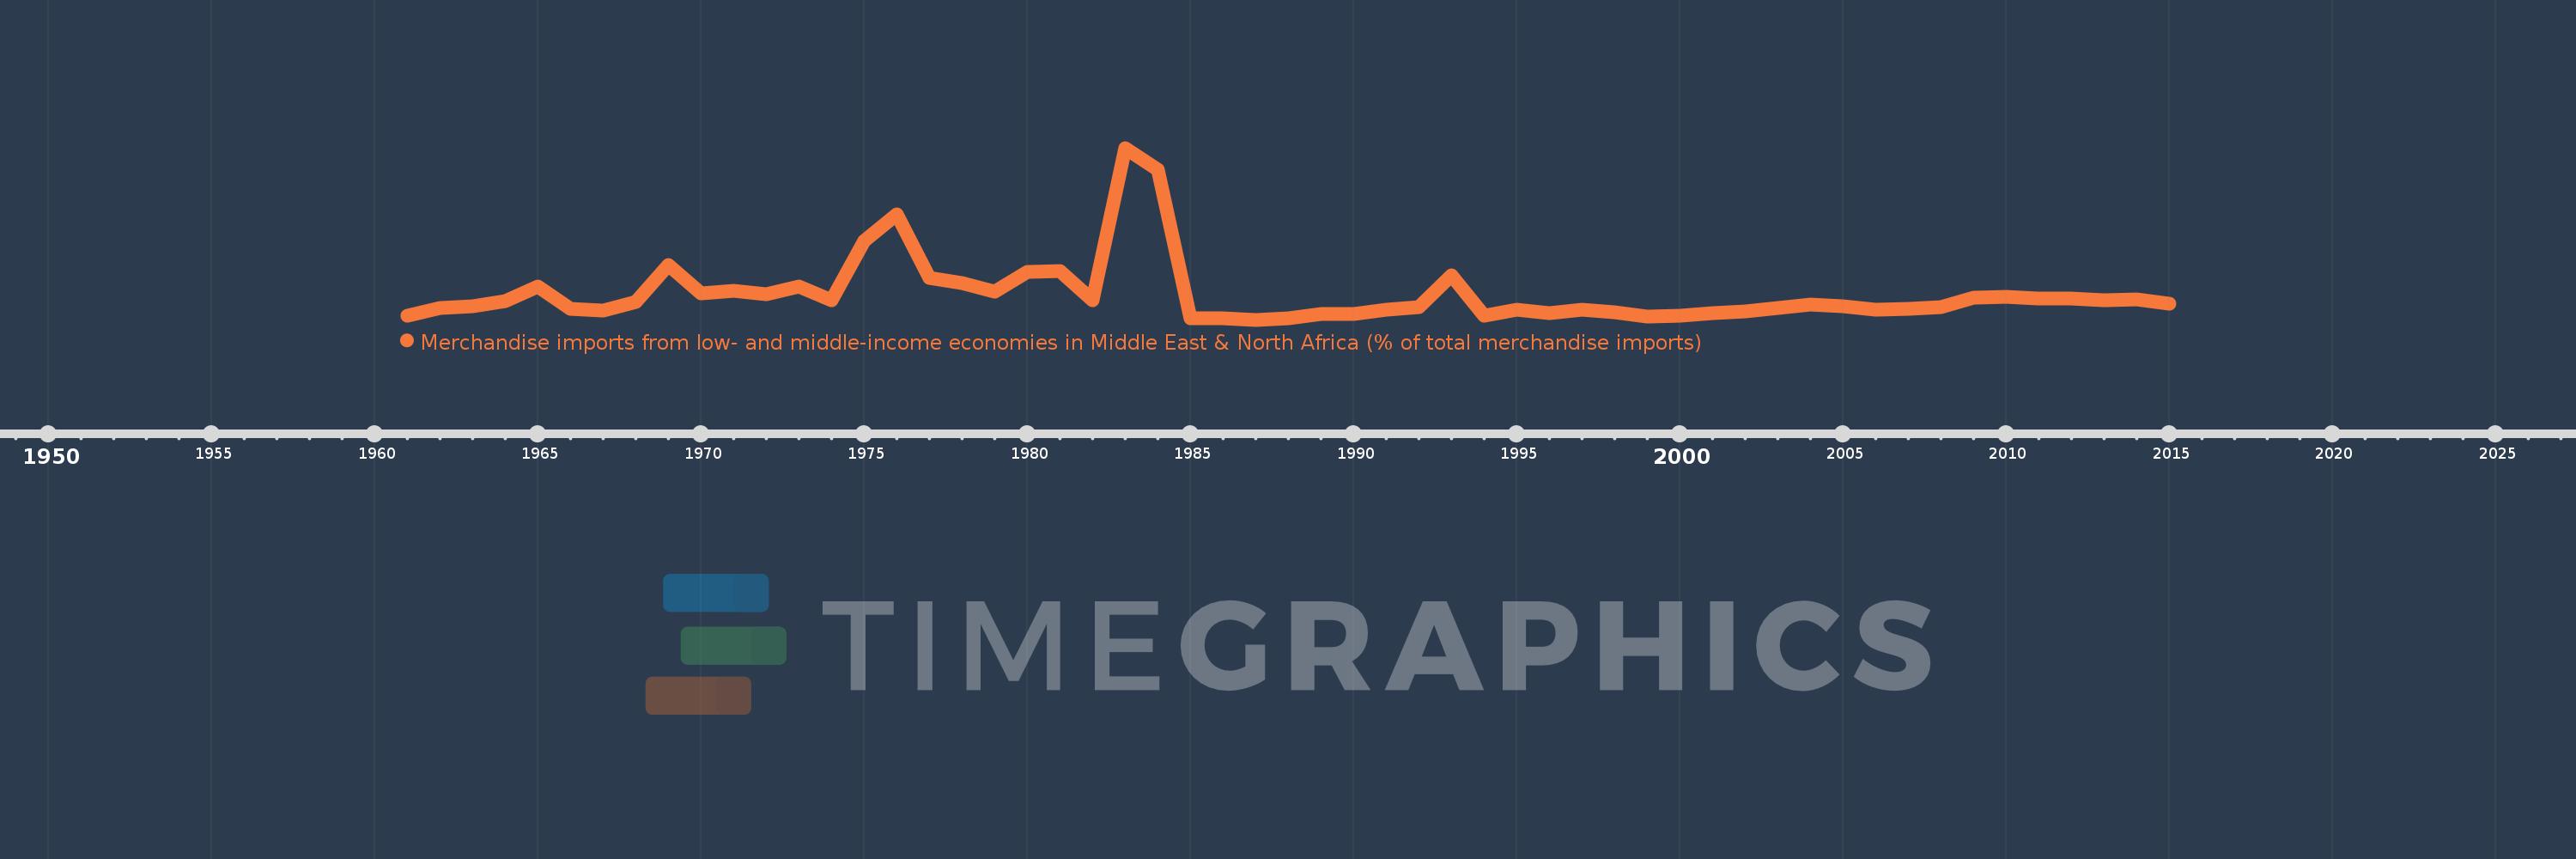
Merchandise imports from low- and middle-income economies in Middle East & North Africa (% of total merchandise imports)
2015,2014,2013,2012,2011,2010,2009,2008,2007,2006,2005,2004,2003,2002,2001,2000,1999,1998,1997,1996,1995,1994,1993,1992,1991,1990,1989,1988,1987,1986,1985,1984,1983,1982,1981,1980,1979,1978,1977,1976,1975,1974,1973,1972,1971,1970,1969,1968,1967,1966,1965,1964,1963,1962,1961
Global statistics library →Ghana →Merchandise imports from low- and middle-income economies in Middle East & North Africa (% of total merchandise imports)
This statistics in other country:
AfghanistanAlbaniaAlgeriaAngolaArab WorldArgentinaArmeniaArubaAustraliaAustriaAzerbaijanBahamas, TheBahrainBangladeshBarbadosBelarusBelgiumBelizeBeninBermudaBoliviaBosnia and HerzegovinaBrazilBrunei DarussalamBulgariaBurkina FasoBurundiCabo VerdeCambodiaCameroonCanadaCaribbean small statesCentral African RepublicCentral Europe and the BalticsChadChileChinaColombiaComorosCongo, Dem. Rep.Congo, Rep.Costa RicaCote d'IvoireCroatiaCubaCyprusCzech RepublicDenmarkDjiboutiDominicaDominican RepublicEarly-demographic dividendEast Asia & PacificEast Asia & Pacific (excluding high income)East Asia & Pacific (IDA & IBRD countries)EcuadorEgypt, Arab Rep.El SalvadorEstoniaEthiopiaEuro areaEurope & Central AsiaEurope & Central Asia (excluding high income)Europe & Central Asia (IDA & IBRD countries)European UnionFijiFinlandFragile and conflict affected situationsFranceFrench PolynesiaGabonGambia, TheGeorgiaGermanyGhanaGreeceGreenlandGrenadaGuatemalaGuineaGuinea-BissauGuyanaHaitiHeavily indebted poor countries (HIPC)High incomeHondurasHong Kong SAR, ChinaHungaryIBRD onlyIcelandIDA & IBRD totalIDA blendIDA onlyIDA totalIndiaIndonesiaIran, Islamic Rep.IraqIrelandIsraelItalyJamaicaJapanJordanKazakhstanKenyaKorea, Dem. People’s Rep.Korea, Rep.KosovoKuwaitKyrgyz RepublicLao PDRLate-demographic dividendLatin America & Caribbean Latin America & Caribbean (excluding high income)Latin America & the Caribbean (IDA & IBRD countries)LatviaLeast developed countries: UN classificationLebanonLiberiaLibyaLithuaniaLow & middle incomeLow incomeLower middle incomeLuxembourgMacao SAR, ChinaMacedonia, FYRMadagascarMalawiMalaysiaMaldivesMaliMaltaMauritaniaMauritiusMexicoMiddle East & North AfricaMiddle East & North Africa (excluding high income)Middle East & North Africa (IDA & IBRD countries)Middle incomeMoldovaMongoliaMontenegroMoroccoMozambiqueMyanmarNepalNetherlandsNew CaledoniaNew ZealandNicaraguaNigerNigeriaNorth AmericaNorwayOECD membersOmanOther small statesPacific island small statesPakistanPanamaPapua New GuineaParaguayPeruPhilippinesPolandPortugalPost-demographic dividendPre-demographic dividendQatarRomaniaRussian FederationRwandaSamoaSaudi ArabiaSenegalSerbiaSeychellesSierra LeoneSingaporeSlovak RepublicSloveniaSmall statesSomaliaSouth AfricaSouth AsiaSouth Asia (IDA & IBRD)SpainSri LankaSt. Kitts and NevisSt. LuciaSt. Vincent and the GrenadinesSub-Saharan Africa Sub-Saharan Africa (excluding high income)Sub-Saharan Africa (IDA & IBRD countries)SudanSurinameSwedenSwitzerlandSyrian Arab RepublicTajikistanTanzaniaThailandTogoTrinidad and TobagoTunisiaTurkeyTurkmenistanUgandaUkraineUnited Arab EmiratesUnited KingdomUnited StatesUpper middle incomeUruguayUzbekistanVenezuela, RBVietnamWorldYemen, Rep.ZambiaZimbabwe Timeline:
This timeline shows a graph from 1961 to 2015 of Ghana. No data until 1960. Number of actual observations by date: 55.
Source name:
World Development Indicators
Source organization:
World Bank staff estimates based data from International Monetary Fund's Direction of Trade database.
Categories, topics:
Private Sector, Trade
Last updated:
apr 23, 2017
Indicators value changes by year
Maximum:
11.528
jan 1, 1983
At the date of observation
Value
Absolute change
Change from previous value
jan 1, 1961
0.304
+0.304
0.0%
jan 1, 1962
0.827
+0.524
172.39%
jan 1, 1963
0.9
+0.073
8.81%
jan 1, 1964
1.263
+0.363
40.28%
jan 1, 1965
2.234
+0.971
76.87%
jan 1, 1966
0.737
-1.497
-67.03%
jan 1, 1967
0.626
-0.11
-14.98%
jan 1, 1968
1.209
+0.582
93.0%
jan 1, 1969
3.689
+2.481
205.23%
jan 1, 1970
1.803
-1.886
-51.13%
jan 1, 1971
1.941
+0.138
7.64%
jan 1, 1972
1.745
-0.196
-10.08%
jan 1, 1973
2.26
+0.514
29.48%
jan 1, 1974
1.317
-0.942
-41.7%
jan 1, 1975
5.315
+3.998
303.48%
jan 1, 1976
7.105
+1.789
33.66%
jan 1, 1977
2.815
-4.29
-60.38%
jan 1, 1978
2.491
-0.324
-11.5%
jan 1, 1979
1.907
-0.584
-23.45%
jan 1, 1980
3.234
+1.327
69.59%
jan 1, 1981
3.279
+0.045
1.39%
jan 1, 1982
1.315
-1.964
-59.9%
jan 1, 1983
11.528
+10.213
776.74%
jan 1, 1984
10.049
-1.48
-12.83%
jan 1, 1985
0.106
-9.942
-98.94%
jan 1, 1986
0.094
-0.012
-11.4%
jan 1, 1987
0.022
-0.072
-76.44%
jan 1, 1988
0.099
+0.077
345.71%
jan 1, 1989
0.407
+0.308
311.5%
jan 1, 1990
0.407
0.0
0.0%
jan 1, 1991
0.714
+0.307
75.3%
jan 1, 1992
0.864
+0.15
21.04%
jan 1, 1993
2.977
+2.113
244.4%
jan 1, 1994
0.304
-2.673
-89.8%
jan 1, 1995
0.706
+0.403
132.66%
jan 1, 1996
0.443
-0.264
-37.32%
jan 1, 1997
0.683
+0.241
54.34%
jan 1, 1998
0.518
-0.166
-24.25%
jan 1, 1999
0.244
-0.273
-52.82%
jan 1, 2000
0.292
+0.048
19.61%
jan 1, 2001
0.489
+0.197
67.28%
jan 1, 2002
0.597
+0.108
22.09%
jan 1, 2003
0.831
+0.235
39.31%
jan 1, 2004
1.013
+0.182
21.88%
jan 1, 2005
0.939
-0.074
-7.27%
jan 1, 2006
0.68
-0.259
-27.58%
jan 1, 2007
0.772
+0.092
13.49%
jan 1, 2008
0.852
+0.08
10.36%
jan 1, 2009
1.526
+0.674
79.14%
jan 1, 2010
1.538
+0.012
0.76%
jan 1, 2011
1.432
-0.106
-6.9%
jan 1, 2012
1.467
+0.036
2.49%
jan 1, 2013
1.354
-0.113
-7.72%
jan 1, 2014
1.375
+0.021
1.54%
jan 1, 2015
1.099
-0.276
-20.08%
Ranking of countries by current statistics by years


Comments: