29
/
en
AIzaSyAYiBZKx7MnpbEhh9jyipgxe19OcubqV5w
April 1, 2024
165131
Jordan
JOR
true
2
1
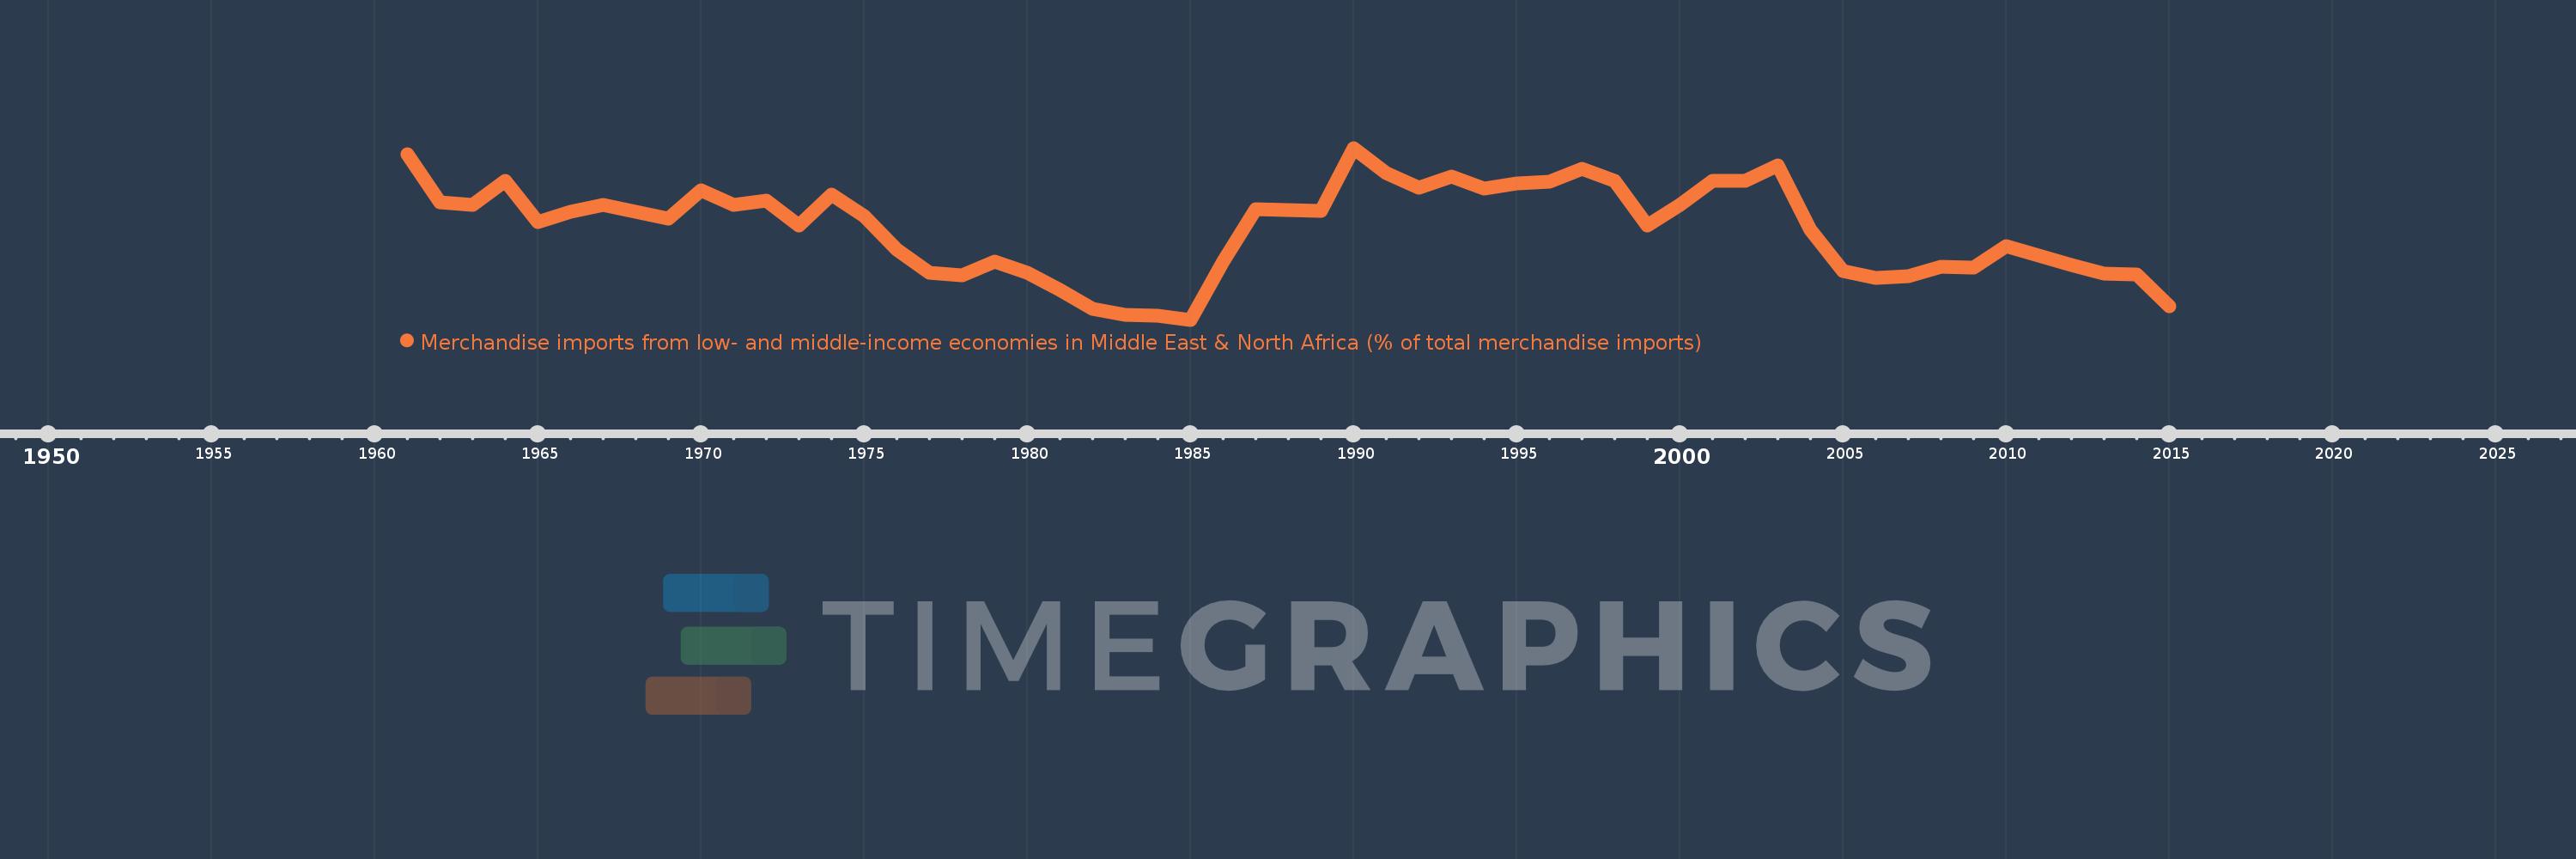
Merchandise imports from low- and middle-income economies in Middle East & North Africa (% of total merchandise imports)
2015,2014,2013,2012,2011,2010,2009,2008,2007,2006,2005,2004,2003,2002,2001,2000,1999,1998,1997,1996,1995,1994,1993,1992,1991,1990,1989,1988,1987,1986,1985,1984,1983,1982,1981,1980,1979,1978,1977,1976,1975,1974,1973,1972,1971,1970,1969,1968,1967,1966,1965,1964,1963,1962,1961
Global statistics library →Jordan →Merchandise imports from low- and middle-income economies in Middle East & North Africa (% of total merchandise imports)
This statistics in other country:
AfghanistanAlbaniaAlgeriaAngolaArab WorldArgentinaArmeniaArubaAustraliaAustriaAzerbaijanBahamas, TheBahrainBangladeshBarbadosBelarusBelgiumBelizeBeninBermudaBoliviaBosnia and HerzegovinaBrazilBrunei DarussalamBulgariaBurkina FasoBurundiCabo VerdeCambodiaCameroonCanadaCaribbean small statesCentral African RepublicCentral Europe and the BalticsChadChileChinaColombiaComorosCongo, Dem. Rep.Congo, Rep.Costa RicaCote d'IvoireCroatiaCubaCyprusCzech RepublicDenmarkDjiboutiDominicaDominican RepublicEarly-demographic dividendEast Asia & PacificEast Asia & Pacific (excluding high income)East Asia & Pacific (IDA & IBRD countries)EcuadorEgypt, Arab Rep.El SalvadorEstoniaEthiopiaEuro areaEurope & Central AsiaEurope & Central Asia (excluding high income)Europe & Central Asia (IDA & IBRD countries)European UnionFijiFinlandFragile and conflict affected situationsFranceFrench PolynesiaGabonGambia, TheGeorgiaGermanyGhanaGreeceGreenlandGrenadaGuatemalaGuineaGuinea-BissauGuyanaHaitiHeavily indebted poor countries (HIPC)High incomeHondurasHong Kong SAR, ChinaHungaryIBRD onlyIcelandIDA & IBRD totalIDA blendIDA onlyIDA totalIndiaIndonesiaIran, Islamic Rep.IraqIrelandIsraelItalyJamaicaJapanJordanKazakhstanKenyaKorea, Dem. People’s Rep.Korea, Rep.KosovoKuwaitKyrgyz RepublicLao PDRLate-demographic dividendLatin America & Caribbean Latin America & Caribbean (excluding high income)Latin America & the Caribbean (IDA & IBRD countries)LatviaLeast developed countries: UN classificationLebanonLiberiaLibyaLithuaniaLow & middle incomeLow incomeLower middle incomeLuxembourgMacao SAR, ChinaMacedonia, FYRMadagascarMalawiMalaysiaMaldivesMaliMaltaMauritaniaMauritiusMexicoMiddle East & North AfricaMiddle East & North Africa (excluding high income)Middle East & North Africa (IDA & IBRD countries)Middle incomeMoldovaMongoliaMontenegroMoroccoMozambiqueMyanmarNepalNetherlandsNew CaledoniaNew ZealandNicaraguaNigerNigeriaNorth AmericaNorwayOECD membersOmanOther small statesPacific island small statesPakistanPanamaPapua New GuineaParaguayPeruPhilippinesPolandPortugalPost-demographic dividendPre-demographic dividendQatarRomaniaRussian FederationRwandaSamoaSaudi ArabiaSenegalSerbiaSeychellesSierra LeoneSingaporeSlovak RepublicSloveniaSmall statesSomaliaSouth AfricaSouth AsiaSouth Asia (IDA & IBRD)SpainSri LankaSt. Kitts and NevisSt. LuciaSt. Vincent and the GrenadinesSub-Saharan Africa Sub-Saharan Africa (excluding high income)Sub-Saharan Africa (IDA & IBRD countries)SudanSurinameSwedenSwitzerlandSyrian Arab RepublicTajikistanTanzaniaThailandTogoTrinidad and TobagoTunisiaTurkeyTurkmenistanUgandaUkraineUnited Arab EmiratesUnited KingdomUnited StatesUpper middle incomeUruguayUzbekistanVenezuela, RBVietnamWorldYemen, Rep.ZambiaZimbabwe Timeline:
This timeline shows a graph from 1961 to 2015 of Jordan. No data until 1960. Number of actual observations by date: 55.
Source name:
World Development Indicators
Source organization:
World Bank staff estimates based data from International Monetary Fund's Direction of Trade database.
Categories, topics:
Private Sector, Trade
Last updated:
apr 23, 2017
Indicators value changes by year
Maximum:
21.575
jan 1, 1990
At the date of observation
Value
Absolute change
Change from previous value
jan 1, 1961
20.934
+20.934
0.0%
jan 1, 1962
15.622
-5.312
-25.37%
jan 1, 1963
15.403
-0.219
-1.4%
jan 1, 1964
18.001
+2.599
16.87%
jan 1, 1965
13.503
-4.499
-24.99%
jan 1, 1966
14.605
+1.102
8.16%
jan 1, 1967
15.397
+0.792
5.43%
jan 1, 1968
14.625
-0.773
-5.02%
jan 1, 1969
13.845
-0.779
-5.33%
jan 1, 1970
16.994
+3.149
22.74%
jan 1, 1971
15.376
-1.618
-9.52%
jan 1, 1972
15.881
+0.505
3.29%
jan 1, 1973
13.077
-2.804
-17.66%
jan 1, 1974
16.512
+3.435
26.27%
jan 1, 1975
14.109
-2.403
-14.55%
jan 1, 1976
10.512
-3.597
-25.5%
jan 1, 1977
7.958
-2.554
-24.29%
jan 1, 1978
7.676
-0.282
-3.55%
jan 1, 1979
9.18
+1.504
19.6%
jan 1, 1980
7.937
-1.243
-13.54%
jan 1, 1981
6.078
-1.859
-23.43%
jan 1, 1982
4.009
-2.069
-34.04%
jan 1, 1983
3.353
-0.656
-16.36%
jan 1, 1984
3.276
-0.078
-2.31%
jan 1, 1985
2.849
-0.427
-13.03%
jan 1, 1986
9.207
+6.358
223.16%
jan 1, 1987
14.876
+5.669
61.57%
jan 1, 1988
14.78
-0.097
-0.65%
jan 1, 1989
14.679
-0.101
-0.68%
jan 1, 1990
21.575
+6.896
46.98%
jan 1, 1991
18.841
-2.734
-12.67%
jan 1, 1992
17.243
-1.598
-8.48%
jan 1, 1993
18.453
+1.21
7.02%
jan 1, 1994
17.137
-1.315
-7.13%
jan 1, 1995
17.725
+0.588
3.43%
jan 1, 1996
17.853
+0.128
0.72%
jan 1, 1997
19.344
+1.491
8.35%
jan 1, 1998
17.987
-1.357
-7.01%
jan 1, 1999
13.144
-4.843
-26.93%
jan 1, 2000
15.339
+2.196
16.7%
jan 1, 2001
17.976
+2.637
17.19%
jan 1, 2002
17.958
-0.018
-0.1%
jan 1, 2003
19.65
+1.692
9.42%
jan 1, 2004
12.664
-6.986
-35.55%
jan 1, 2005
8.199
-4.465
-35.26%
jan 1, 2006
7.367
-0.832
-10.14%
jan 1, 2007
7.575
+0.207
2.81%
jan 1, 2008
8.613
+1.039
13.71%
jan 1, 2009
8.511
-0.103
-1.19%
jan 1, 2010
10.917
+2.406
28.27%
jan 1, 2011
9.851
-1.065
-9.76%
jan 1, 2012
8.769
-1.083
-10.99%
jan 1, 2013
7.861
-0.907
-10.35%
jan 1, 2014
7.767
-0.094
-1.2%
jan 1, 2015
4.346
-3.421
-44.05%
Ranking of countries by current statistics by years


Comments: