29
/
en
AIzaSyAYiBZKx7MnpbEhh9jyipgxe19OcubqV5w
April 1, 2024
153798
Iceland
ISL
true
2
1
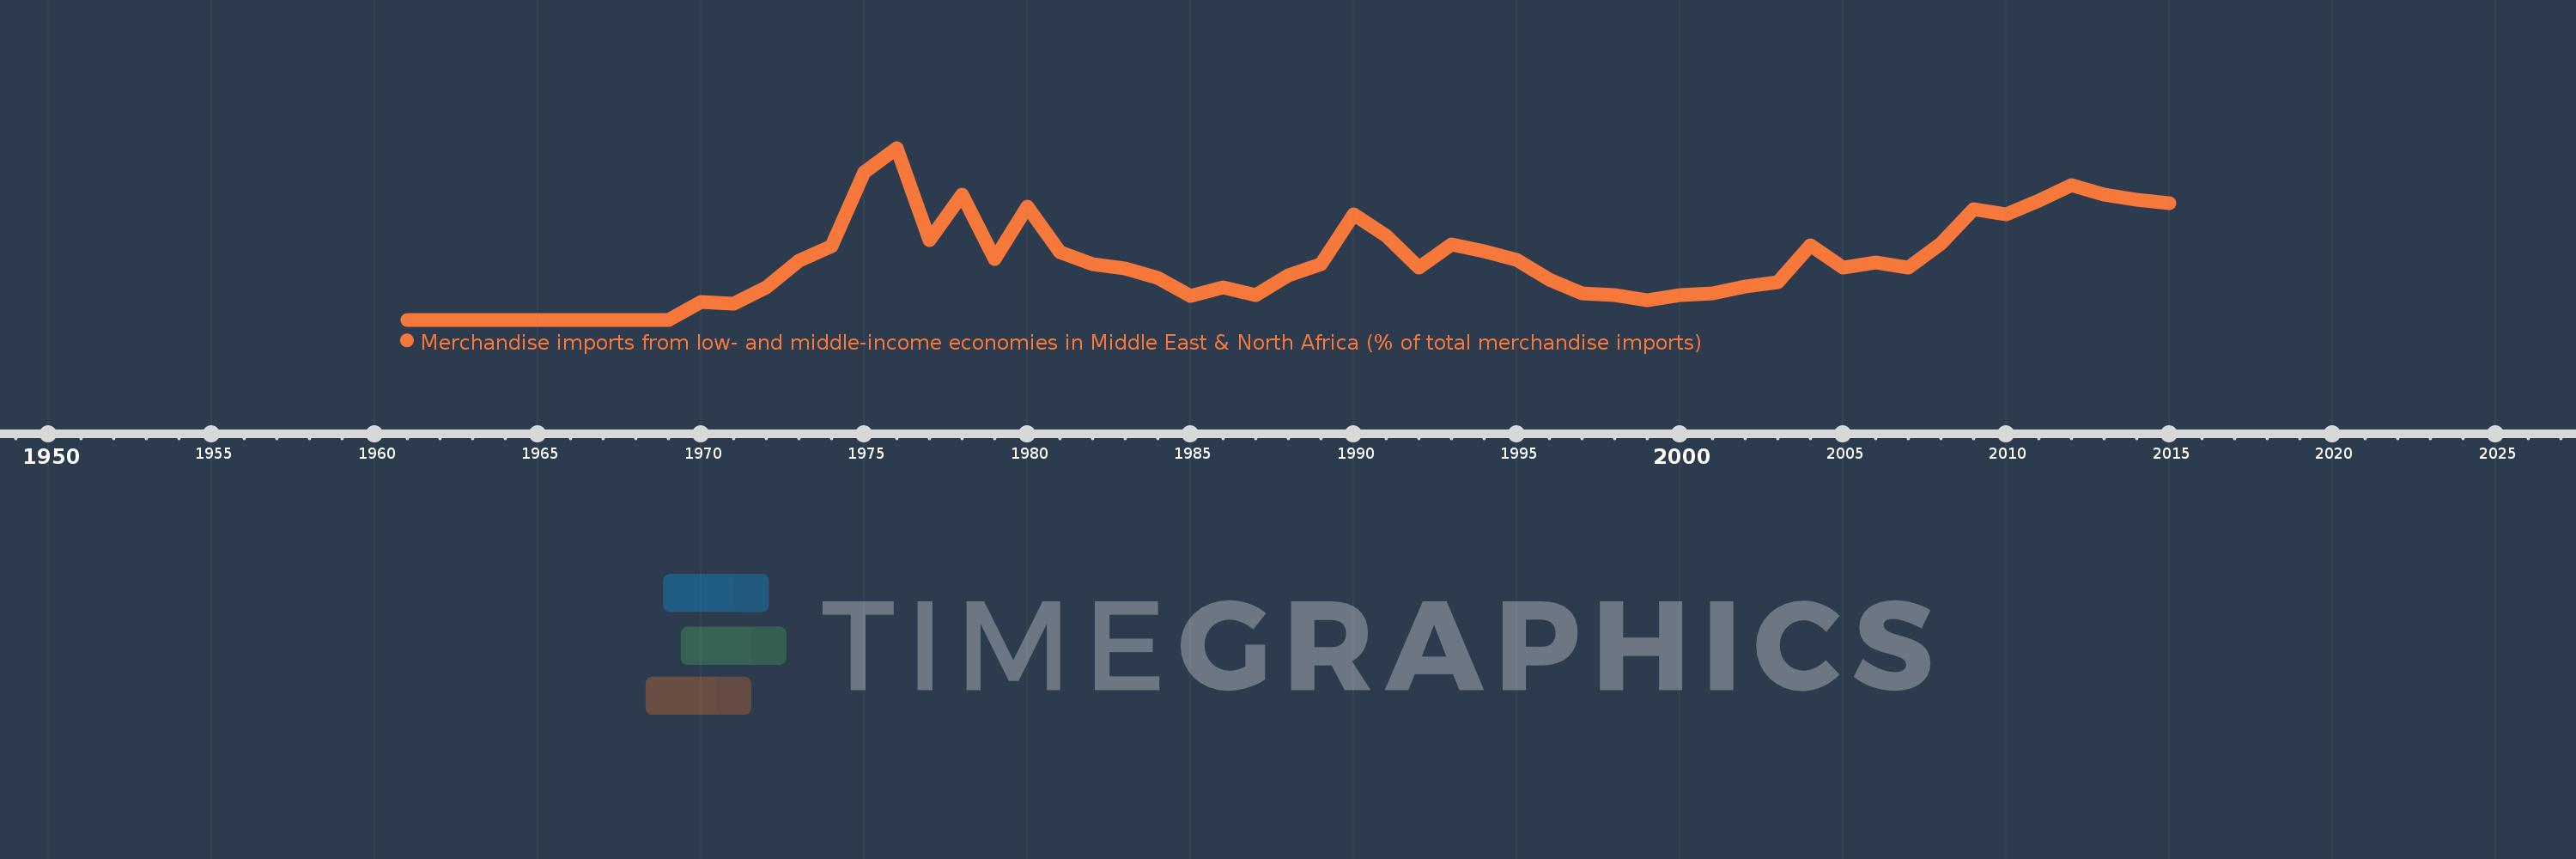
Merchandise imports from low- and middle-income economies in Middle East & North Africa (% of total merchandise imports)
2015,2014,2013,2012,2011,2010,2009,2008,2007,2006,2005,2004,2003,2002,2001,2000,1999,1998,1997,1996,1995,1994,1993,1992,1991,1990,1989,1988,1987,1986,1985,1984,1983,1982,1981,1980,1979,1978,1977,1976,1975,1974,1973,1972,1971,1970,1969,1968,1967,1966,1965,1964,1963,1962,1961
This statistics in other country:
AfghanistanAlbaniaAlgeriaAngolaArab WorldArgentinaArmeniaArubaAustraliaAustriaAzerbaijanBahamas, TheBahrainBangladeshBarbadosBelarusBelgiumBelizeBeninBermudaBoliviaBosnia and HerzegovinaBrazilBrunei DarussalamBulgariaBurkina FasoBurundiCabo VerdeCambodiaCameroonCanadaCaribbean small statesCentral African RepublicCentral Europe and the BalticsChadChileChinaColombiaComorosCongo, Dem. Rep.Congo, Rep.Costa RicaCote d'IvoireCroatiaCubaCyprusCzech RepublicDenmarkDjiboutiDominicaDominican RepublicEarly-demographic dividendEast Asia & PacificEast Asia & Pacific (excluding high income)East Asia & Pacific (IDA & IBRD countries)EcuadorEgypt, Arab Rep.El SalvadorEstoniaEthiopiaEuro areaEurope & Central AsiaEurope & Central Asia (excluding high income)Europe & Central Asia (IDA & IBRD countries)European UnionFijiFinlandFragile and conflict affected situationsFranceFrench PolynesiaGabonGambia, TheGeorgiaGermanyGhanaGreeceGreenlandGrenadaGuatemalaGuineaGuinea-BissauGuyanaHaitiHeavily indebted poor countries (HIPC)High incomeHondurasHong Kong SAR, ChinaHungaryIBRD onlyIcelandIDA & IBRD totalIDA blendIDA onlyIDA totalIndiaIndonesiaIran, Islamic Rep.IraqIrelandIsraelItalyJamaicaJapanJordanKazakhstanKenyaKorea, Dem. People’s Rep.Korea, Rep.KosovoKuwaitKyrgyz RepublicLao PDRLate-demographic dividendLatin America & Caribbean Latin America & Caribbean (excluding high income)Latin America & the Caribbean (IDA & IBRD countries)LatviaLeast developed countries: UN classificationLebanonLiberiaLibyaLithuaniaLow & middle incomeLow incomeLower middle incomeLuxembourgMacao SAR, ChinaMacedonia, FYRMadagascarMalawiMalaysiaMaldivesMaliMaltaMauritaniaMauritiusMexicoMiddle East & North AfricaMiddle East & North Africa (excluding high income)Middle East & North Africa (IDA & IBRD countries)Middle incomeMoldovaMongoliaMontenegroMoroccoMozambiqueMyanmarNepalNetherlandsNew CaledoniaNew ZealandNicaraguaNigerNigeriaNorth AmericaNorwayOECD membersOmanOther small statesPacific island small statesPakistanPanamaPapua New GuineaParaguayPeruPhilippinesPolandPortugalPost-demographic dividendPre-demographic dividendQatarRomaniaRussian FederationRwandaSamoaSaudi ArabiaSenegalSerbiaSeychellesSierra LeoneSingaporeSlovak RepublicSloveniaSmall statesSomaliaSouth AfricaSouth AsiaSouth Asia (IDA & IBRD)SpainSri LankaSt. Kitts and NevisSt. LuciaSt. Vincent and the GrenadinesSub-Saharan Africa Sub-Saharan Africa (excluding high income)Sub-Saharan Africa (IDA & IBRD countries)SudanSurinameSwedenSwitzerlandSyrian Arab RepublicTajikistanTanzaniaThailandTogoTrinidad and TobagoTunisiaTurkeyTurkmenistanUgandaUkraineUnited Arab EmiratesUnited KingdomUnited StatesUpper middle incomeUruguayUzbekistanVenezuela, RBVietnamWorldYemen, Rep.ZambiaZimbabwe Timeline:
This timeline shows a graph from 1961 to 2015 of Iceland. No data until 1960. Number of actual observations by date: 55.
Source name:
World Development Indicators
Source organization:
World Bank staff estimates based data from International Monetary Fund's Direction of Trade database.
Categories, topics:
Private Sector, Trade
Last updated:
apr 23, 2017
Indicators value changes by year
At the date of observation
Value
Absolute change
Change from previous value
jan 1, 1970
0.047
+0.047
%
jan 1, 1971
0.043
-0.004
-9.32%
jan 1, 1972
0.086
+0.043
101.62%
jan 1, 1973
0.158
+0.072
84.32%
jan 1, 1974
0.199
+0.041
25.97%
jan 1, 1975
0.396
+0.197
98.77%
jan 1, 1976
0.462
+0.066
16.7%
jan 1, 1977
0.214
-0.249
-53.81%
jan 1, 1978
0.337
+0.123
57.59%
jan 1, 1979
0.163
-0.174
-51.66%
jan 1, 1980
0.305
+0.142
87.41%
jan 1, 1981
0.181
-0.124
-40.49%
jan 1, 1982
0.15
-0.031
-17.28%
jan 1, 1983
0.139
-0.011
-7.18%
jan 1, 1984
0.112
-0.027
-19.51%
jan 1, 1985
0.065
-0.047
-42.17%
jan 1, 1986
0.088
+0.023
36.08%
jan 1, 1987
0.067
-0.022
-24.47%
jan 1, 1988
0.119
+0.053
79.2%
jan 1, 1989
0.15
+0.031
25.72%
jan 1, 1990
0.284
+0.133
88.79%
jan 1, 1991
0.226
-0.057
-20.22%
jan 1, 1992
0.141
-0.086
-37.83%
jan 1, 1993
0.202
+0.061
43.62%
jan 1, 1994
0.184
-0.018
-9.0%
jan 1, 1995
0.161
-0.022
-12.15%
jan 1, 1996
0.109
-0.053
-32.64%
jan 1, 1997
0.07
-0.039
-35.96%
jan 1, 1998
0.067
-0.003
-3.84%
jan 1, 1999
0.052
-0.015
-22.24%
jan 1, 2000
0.067
+0.015
29.08%
jan 1, 2001
0.071
+0.003
5.1%
jan 1, 2002
0.09
+0.019
26.67%
jan 1, 2003
0.102
+0.013
14.15%
jan 1, 2004
0.201
+0.099
97.08%
jan 1, 2005
0.14
-0.061
-30.53%
jan 1, 2006
0.153
+0.013
9.61%
jan 1, 2007
0.14
-0.013
-8.56%
jan 1, 2008
0.204
+0.064
45.59%
jan 1, 2009
0.297
+0.093
45.72%
jan 1, 2010
0.283
-0.014
-4.86%
jan 1, 2011
0.32
+0.037
13.08%
jan 1, 2012
0.363
+0.043
13.45%
jan 1, 2013
0.336
-0.027
-7.5%
jan 1, 2014
0.322
-0.014
-4.18%
jan 1, 2015
0.314
-0.008
-2.49%
Ranking of countries by current statistics by years


Comments: