29
/
en
AIzaSyAYiBZKx7MnpbEhh9jyipgxe19OcubqV5w
April 1, 2024
156290
Indonesia
IDN
true
2
1
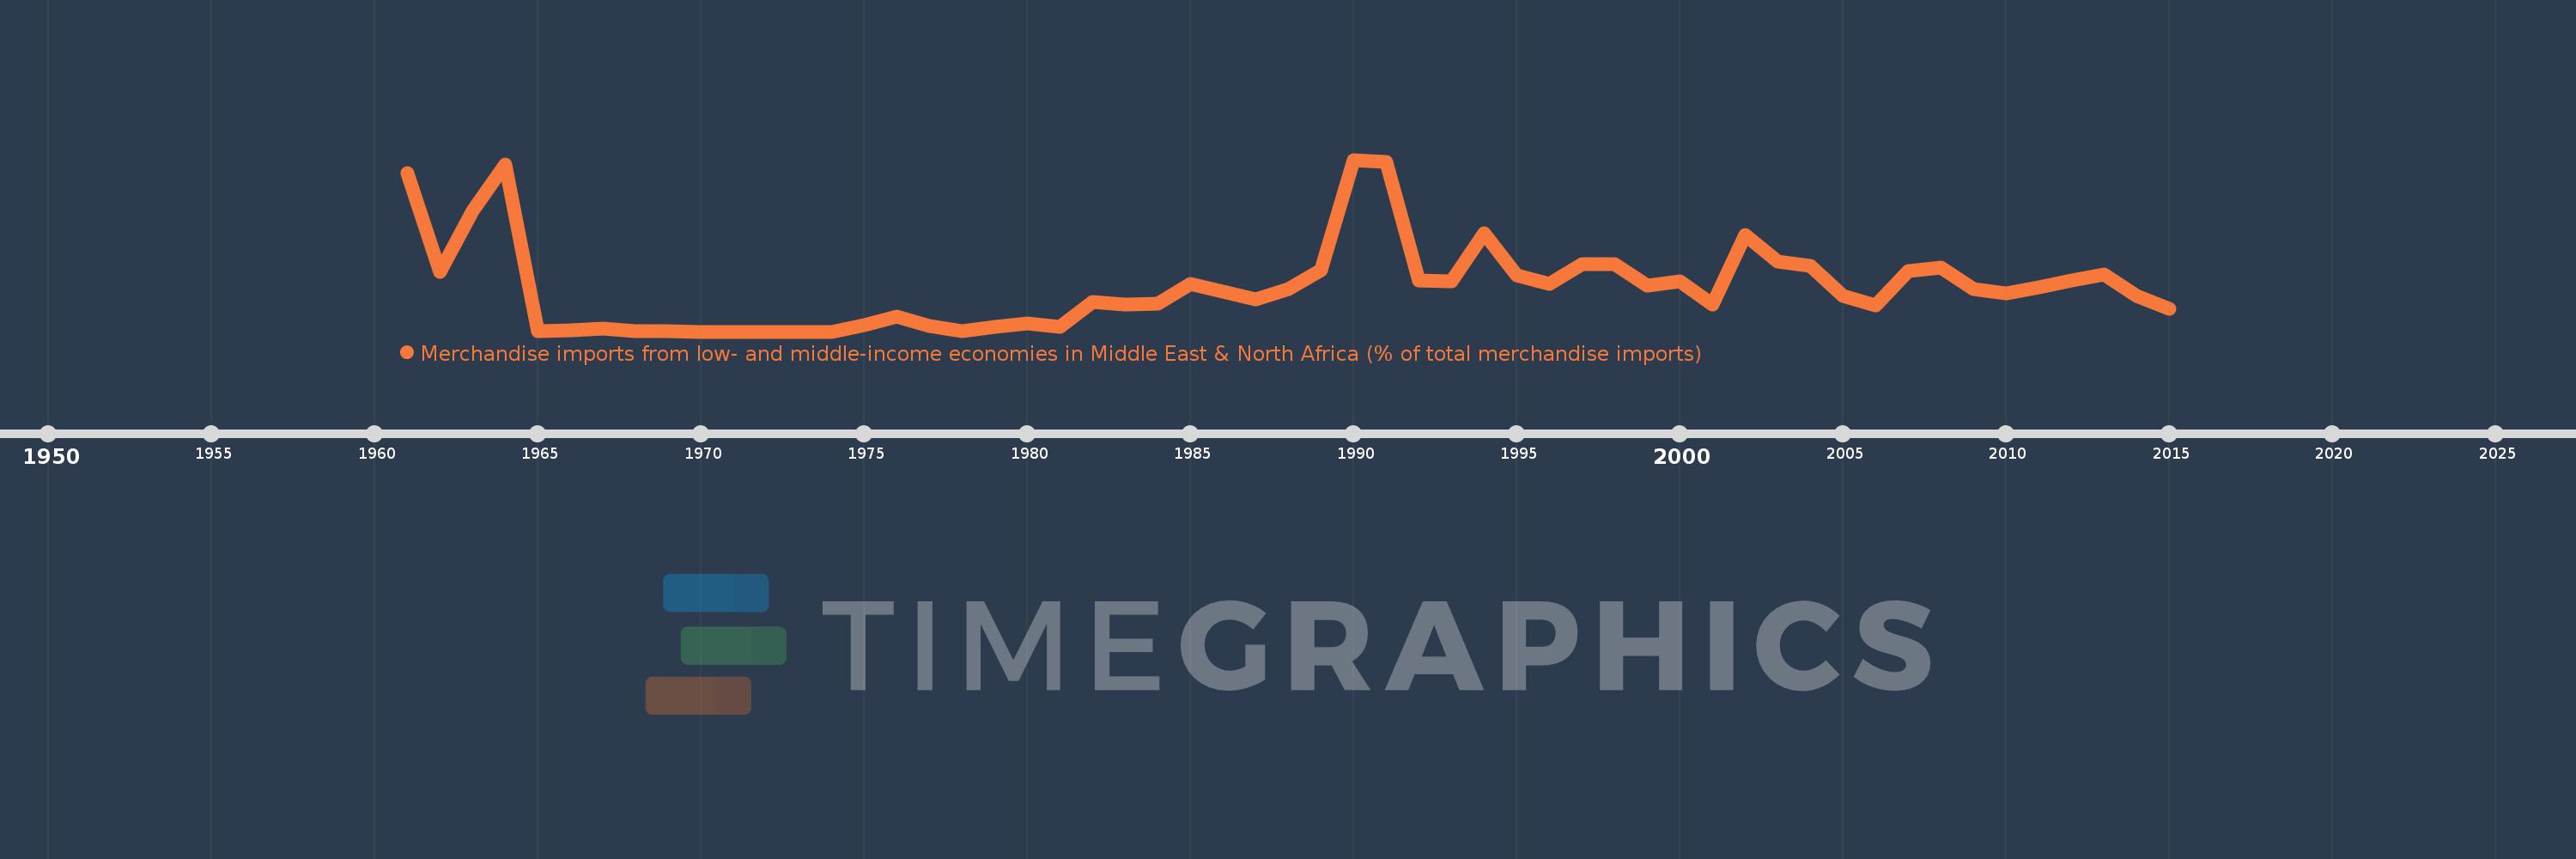
Merchandise imports from low- and middle-income economies in Middle East & North Africa (% of total merchandise imports)
2015,2014,2013,2012,2011,2010,2009,2008,2007,2006,2005,2004,2003,2002,2001,2000,1999,1998,1997,1996,1995,1994,1993,1992,1991,1990,1989,1988,1987,1986,1985,1984,1983,1982,1981,1980,1979,1978,1977,1976,1975,1974,1973,1972,1971,1970,1969,1968,1967,1966,1965,1964,1963,1962,1961
This statistics in other country:
AfghanistanAlbaniaAlgeriaAngolaArab WorldArgentinaArmeniaArubaAustraliaAustriaAzerbaijanBahamas, TheBahrainBangladeshBarbadosBelarusBelgiumBelizeBeninBermudaBoliviaBosnia and HerzegovinaBrazilBrunei DarussalamBulgariaBurkina FasoBurundiCabo VerdeCambodiaCameroonCanadaCaribbean small statesCentral African RepublicCentral Europe and the BalticsChadChileChinaColombiaComorosCongo, Dem. Rep.Congo, Rep.Costa RicaCote d'IvoireCroatiaCubaCyprusCzech RepublicDenmarkDjiboutiDominicaDominican RepublicEarly-demographic dividendEast Asia & PacificEast Asia & Pacific (excluding high income)East Asia & Pacific (IDA & IBRD countries)EcuadorEgypt, Arab Rep.El SalvadorEstoniaEthiopiaEuro areaEurope & Central AsiaEurope & Central Asia (excluding high income)Europe & Central Asia (IDA & IBRD countries)European UnionFijiFinlandFragile and conflict affected situationsFranceFrench PolynesiaGabonGambia, TheGeorgiaGermanyGhanaGreeceGreenlandGrenadaGuatemalaGuineaGuinea-BissauGuyanaHaitiHeavily indebted poor countries (HIPC)High incomeHondurasHong Kong SAR, ChinaHungaryIBRD onlyIcelandIDA & IBRD totalIDA blendIDA onlyIDA totalIndiaIndonesiaIran, Islamic Rep.IraqIrelandIsraelItalyJamaicaJapanJordanKazakhstanKenyaKorea, Dem. People’s Rep.Korea, Rep.KosovoKuwaitKyrgyz RepublicLao PDRLate-demographic dividendLatin America & Caribbean Latin America & Caribbean (excluding high income)Latin America & the Caribbean (IDA & IBRD countries)LatviaLeast developed countries: UN classificationLebanonLiberiaLibyaLithuaniaLow & middle incomeLow incomeLower middle incomeLuxembourgMacao SAR, ChinaMacedonia, FYRMadagascarMalawiMalaysiaMaldivesMaliMaltaMauritaniaMauritiusMexicoMiddle East & North AfricaMiddle East & North Africa (excluding high income)Middle East & North Africa (IDA & IBRD countries)Middle incomeMoldovaMongoliaMontenegroMoroccoMozambiqueMyanmarNepalNetherlandsNew CaledoniaNew ZealandNicaraguaNigerNigeriaNorth AmericaNorwayOECD membersOmanOther small statesPacific island small statesPakistanPanamaPapua New GuineaParaguayPeruPhilippinesPolandPortugalPost-demographic dividendPre-demographic dividendQatarRomaniaRussian FederationRwandaSamoaSaudi ArabiaSenegalSerbiaSeychellesSierra LeoneSingaporeSlovak RepublicSloveniaSmall statesSomaliaSouth AfricaSouth AsiaSouth Asia (IDA & IBRD)SpainSri LankaSt. Kitts and NevisSt. LuciaSt. Vincent and the GrenadinesSub-Saharan Africa Sub-Saharan Africa (excluding high income)Sub-Saharan Africa (IDA & IBRD countries)SudanSurinameSwedenSwitzerlandSyrian Arab RepublicTajikistanTanzaniaThailandTogoTrinidad and TobagoTunisiaTurkeyTurkmenistanUgandaUkraineUnited Arab EmiratesUnited KingdomUnited StatesUpper middle incomeUruguayUzbekistanVenezuela, RBVietnamWorldYemen, Rep.ZambiaZimbabwe Timeline:
This timeline shows a graph from 1961 to 2015 of Indonesia. No data until 1960. Number of actual observations by date: 55.
Source name:
World Development Indicators
Source organization:
World Bank staff estimates based data from International Monetary Fund's Direction of Trade database.
Categories, topics:
Private Sector, Trade
Last updated:
apr 23, 2017
Indicators value changes by year
At the date of observation
Value
Absolute change
Change from previous value
jan 1, 1961
3.447
+3.447
0.0%
jan 1, 1962
1.304
-2.142
-62.15%
jan 1, 1963
2.625
+1.32
101.23%
jan 1, 1964
3.624
+0.999
38.06%
jan 1, 1965
0.015
-3.609
-99.58%
jan 1, 1966
0.03
+0.015
98.33%
jan 1, 1967
0.059
+0.029
95.86%
jan 1, 1968
0.016
-0.044
-73.61%
jan 1, 1969
0.014
-0.002
-9.93%
jan 1, 1970
0.0
-0.014
-100.0%
jan 1, 1975
0.138
+0.138
%
jan 1, 1976
0.327
+0.189
137.09%
jan 1, 1977
0.113
-0.214
-65.51%
jan 1, 1978
0.01
-0.103
-91.46%
jan 1, 1979
0.099
+0.089
924.09%
jan 1, 1980
0.183
+0.084
85.18%
jan 1, 1981
0.099
-0.084
-45.95%
jan 1, 1982
0.653
+0.554
561.0%
jan 1, 1983
0.591
-0.062
-9.47%
jan 1, 1984
0.612
+0.021
3.62%
jan 1, 1985
1.038
+0.426
69.59%
jan 1, 1986
0.876
-0.162
-15.63%
jan 1, 1987
0.708
-0.168
-19.2%
jan 1, 1988
0.928
+0.22
31.13%
jan 1, 1989
1.336
+0.408
43.95%
jan 1, 1990
3.735
+2.4
179.62%
jan 1, 1991
3.679
-0.056
-1.5%
jan 1, 1992
1.114
-2.565
-69.72%
jan 1, 1993
1.101
-0.013
-1.2%
jan 1, 1994
2.137
+1.036
94.13%
jan 1, 1995
1.224
-0.913
-42.73%
jan 1, 1996
1.043
-0.18
-14.74%
jan 1, 1997
1.462
+0.419
40.18%
jan 1, 1998
1.468
+0.005
0.35%
jan 1, 1999
1.004
-0.464
-31.6%
jan 1, 2000
1.09
+0.086
8.54%
jan 1, 2001
0.581
-0.508
-46.65%
jan 1, 2002
2.108
+1.527
262.74%
jan 1, 2003
1.516
-0.593
-28.11%
jan 1, 2004
1.429
-0.087
-5.73%
jan 1, 2005
0.782
-0.646
-45.23%
jan 1, 2006
0.564
-0.219
-27.98%
jan 1, 2007
1.311
+0.748
132.68%
jan 1, 2008
1.4
+0.089
6.8%
jan 1, 2009
0.93
-0.47
-33.57%
jan 1, 2010
0.837
-0.094
-10.07%
jan 1, 2011
0.957
+0.121
14.44%
jan 1, 2012
1.103
+0.145
15.18%
jan 1, 2013
1.241
+0.138
12.5%
jan 1, 2014
0.776
-0.465
-37.49%
jan 1, 2015
0.488
-0.288
-37.13%
Ranking of countries by current statistics by years


Comments: