29
/
en
AIzaSyAYiBZKx7MnpbEhh9jyipgxe19OcubqV5w
April 1, 2024
286178
Zambia
ZMB
true
2
1
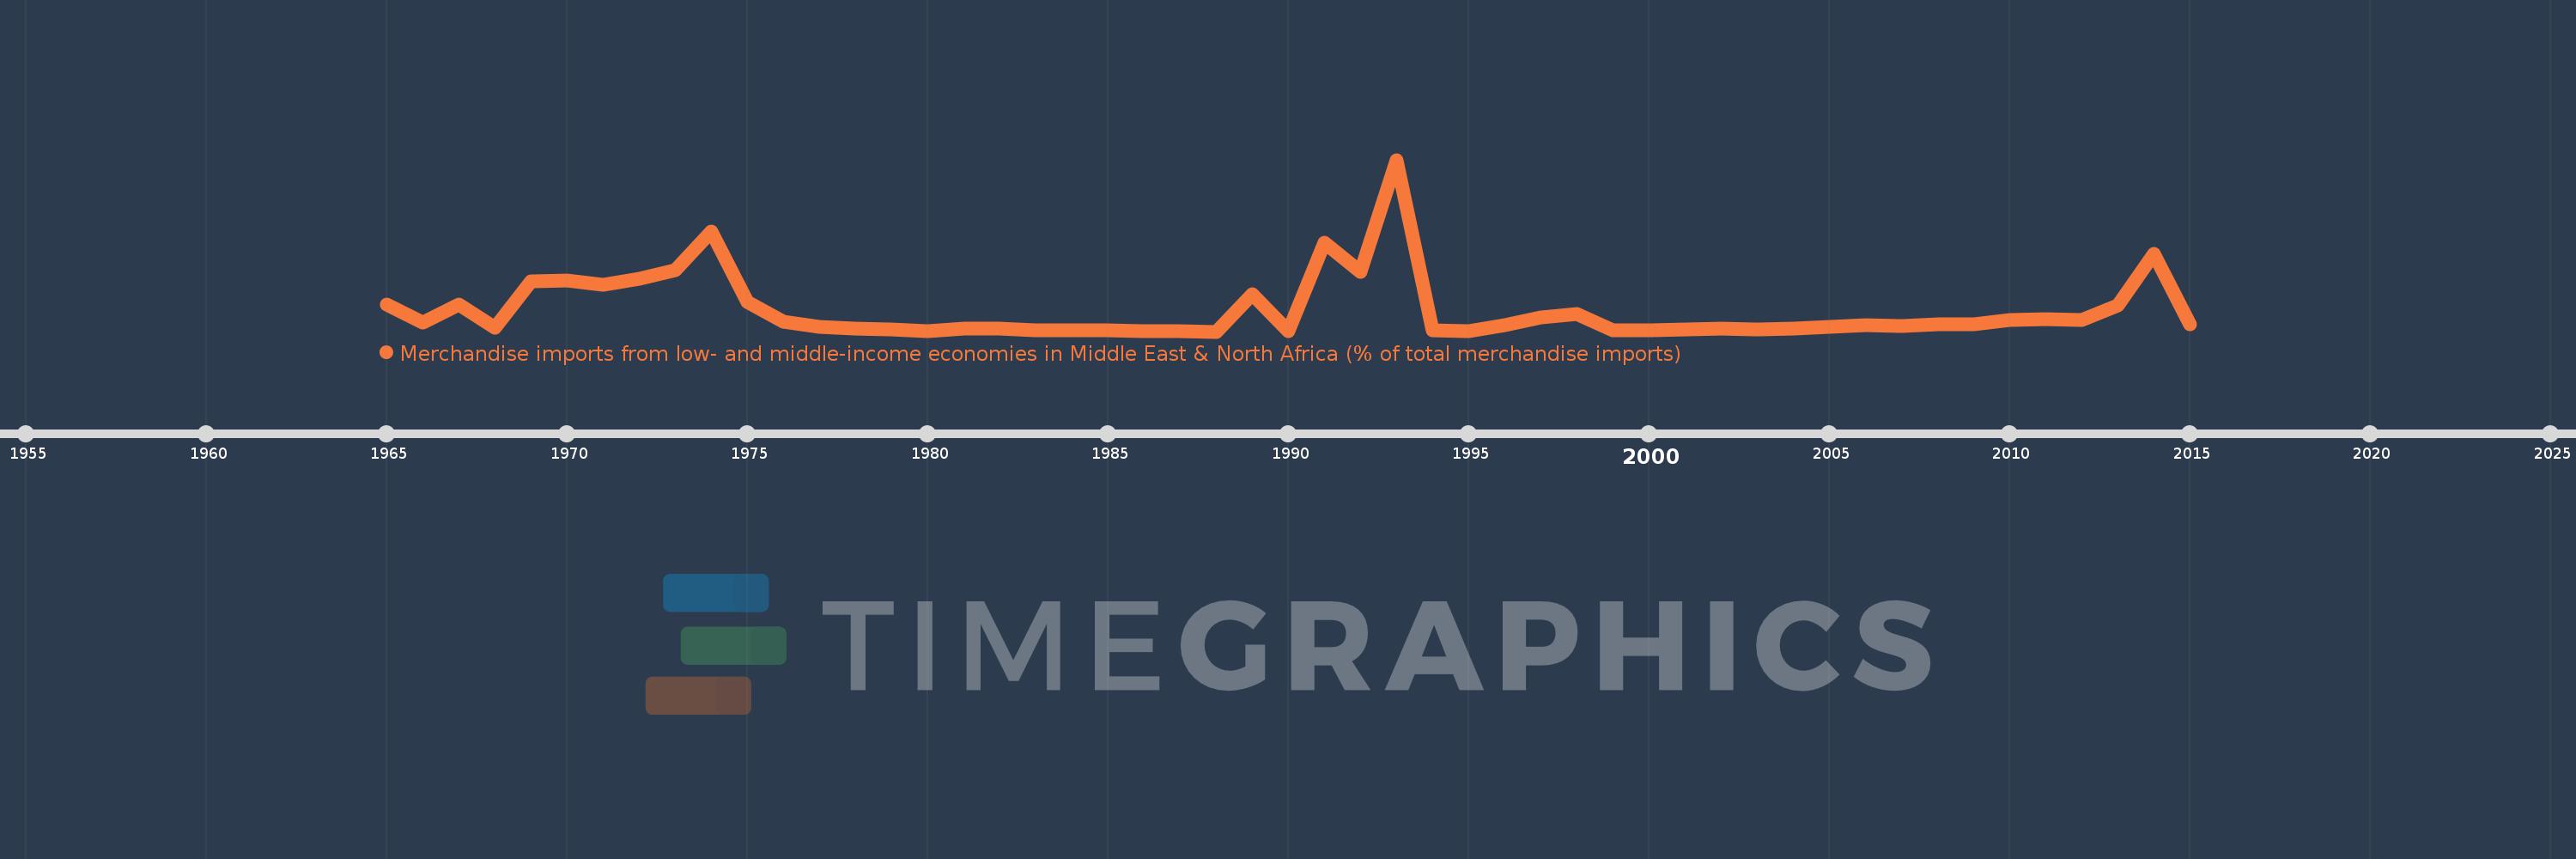
Merchandise imports from low- and middle-income economies in Middle East & North Africa (% of total merchandise imports)
2015,2014,2013,2012,2011,2010,2009,2008,2007,2006,2005,2004,2003,2002,2001,2000,1999,1998,1997,1996,1995,1994,1993,1992,1991,1990,1989,1988,1987,1986,1985,1984,1983,1982,1981,1980,1979,1978,1977,1976,1975,1974,1973,1972,1971,1970,1969,1968,1967,1966,1965
Global statistics library →Zambia →Merchandise imports from low- and middle-income economies in Middle East & North Africa (% of total merchandise imports)
This statistics in other country:
AfghanistanAlbaniaAlgeriaAngolaArab WorldArgentinaArmeniaArubaAustraliaAustriaAzerbaijanBahamas, TheBahrainBangladeshBarbadosBelarusBelgiumBelizeBeninBermudaBoliviaBosnia and HerzegovinaBrazilBrunei DarussalamBulgariaBurkina FasoBurundiCabo VerdeCambodiaCameroonCanadaCaribbean small statesCentral African RepublicCentral Europe and the BalticsChadChileChinaColombiaComorosCongo, Dem. Rep.Congo, Rep.Costa RicaCote d'IvoireCroatiaCubaCyprusCzech RepublicDenmarkDjiboutiDominicaDominican RepublicEarly-demographic dividendEast Asia & PacificEast Asia & Pacific (excluding high income)East Asia & Pacific (IDA & IBRD countries)EcuadorEgypt, Arab Rep.El SalvadorEstoniaEthiopiaEuro areaEurope & Central AsiaEurope & Central Asia (excluding high income)Europe & Central Asia (IDA & IBRD countries)European UnionFijiFinlandFragile and conflict affected situationsFranceFrench PolynesiaGabonGambia, TheGeorgiaGermanyGhanaGreeceGreenlandGrenadaGuatemalaGuineaGuinea-BissauGuyanaHaitiHeavily indebted poor countries (HIPC)High incomeHondurasHong Kong SAR, ChinaHungaryIBRD onlyIcelandIDA & IBRD totalIDA blendIDA onlyIDA totalIndiaIndonesiaIran, Islamic Rep.IraqIrelandIsraelItalyJamaicaJapanJordanKazakhstanKenyaKorea, Dem. People’s Rep.Korea, Rep.KosovoKuwaitKyrgyz RepublicLao PDRLate-demographic dividendLatin America & Caribbean Latin America & Caribbean (excluding high income)Latin America & the Caribbean (IDA & IBRD countries)LatviaLeast developed countries: UN classificationLebanonLiberiaLibyaLithuaniaLow & middle incomeLow incomeLower middle incomeLuxembourgMacao SAR, ChinaMacedonia, FYRMadagascarMalawiMalaysiaMaldivesMaliMaltaMauritaniaMauritiusMexicoMiddle East & North AfricaMiddle East & North Africa (excluding high income)Middle East & North Africa (IDA & IBRD countries)Middle incomeMoldovaMongoliaMontenegroMoroccoMozambiqueMyanmarNepalNetherlandsNew CaledoniaNew ZealandNicaraguaNigerNigeriaNorth AmericaNorwayOECD membersOmanOther small statesPacific island small statesPakistanPanamaPapua New GuineaParaguayPeruPhilippinesPolandPortugalPost-demographic dividendPre-demographic dividendQatarRomaniaRussian FederationRwandaSamoaSaudi ArabiaSenegalSerbiaSeychellesSierra LeoneSingaporeSlovak RepublicSloveniaSmall statesSomaliaSouth AfricaSouth AsiaSouth Asia (IDA & IBRD)SpainSri LankaSt. Kitts and NevisSt. LuciaSt. Vincent and the GrenadinesSub-Saharan Africa Sub-Saharan Africa (excluding high income)Sub-Saharan Africa (IDA & IBRD countries)SudanSurinameSwedenSwitzerlandSyrian Arab RepublicTajikistanTanzaniaThailandTogoTrinidad and TobagoTunisiaTurkeyTurkmenistanUgandaUkraineUnited Arab EmiratesUnited KingdomUnited StatesUpper middle incomeUruguayUzbekistanVenezuela, RBVietnamWorldYemen, Rep.ZambiaZimbabwe Timeline:
This timeline shows a graph from 1965 to 2015 of Zambia. No data until 1964. Number of actual observations by date: 51.
Source name:
World Development Indicators
Source organization:
World Bank staff estimates based data from International Monetary Fund's Direction of Trade database.
Categories, topics:
Private Sector, Trade
Last updated:
apr 23, 2017
Indicators value changes by year
At the date of observation
Value
Absolute change
Change from previous value
jan 1, 1965
1.397
+1.397
0.0%
jan 1, 1966
0.477
-0.92
-65.86%
jan 1, 1967
1.371
+0.895
187.62%
jan 1, 1968
0.218
-1.153
-84.1%
jan 1, 1969
2.597
+2.379
1.09K%
jan 1, 1970
2.622
+0.024
0.94%
jan 1, 1971
2.396
-0.225
-8.6%
jan 1, 1972
2.715
+0.319
13.29%
jan 1, 1973
3.167
+0.452
16.65%
jan 1, 1974
5.134
+1.967
62.1%
jan 1, 1975
1.505
-3.629
-70.69%
jan 1, 1976
0.502
-1.002
-66.62%
jan 1, 1977
0.248
-0.254
-50.52%
jan 1, 1978
0.161
-0.087
-35.13%
jan 1, 1979
0.099
-0.062
-38.58%
jan 1, 1980
0.05
-0.049
-49.27%
jan 1, 1981
0.147
+0.097
192.45%
jan 1, 1982
0.154
+0.007
4.94%
jan 1, 1983
0.058
-0.096
-62.52%
jan 1, 1984
0.058
0.0
0.0%
jan 1, 1985
0.058
+0.0
0.15%
jan 1, 1986
0.021
-0.036
-62.97%
jan 1, 1987
0.021
0.0
-0.95%
jan 1, 1988
0.007
-0.015
-68.35%
jan 1, 1989
1.936
+1.929
28.72K%
jan 1, 1990
0.009
-1.927
-99.55%
jan 1, 1991
4.568
+4.559
52.42K%
jan 1, 1992
3.068
-1.5
-32.84%
jan 1, 1993
8.789
+5.721
186.5%
jan 1, 1994
0.074
-8.715
-99.16%
jan 1, 1995
0.05
-0.024
-32.98%
jan 1, 1996
0.326
+0.277
558.01%
jan 1, 1997
0.739
+0.413
126.49%
jan 1, 1998
0.914
+0.175
23.68%
jan 1, 1999
0.077
-0.836
-91.53%
jan 1, 2000
0.077
0.0
-0.57%
jan 1, 2001
0.112
+0.035
45.31%
jan 1, 2002
0.154
+0.042
37.77%
jan 1, 2003
0.103
-0.051
-33.16%
jan 1, 2004
0.168
+0.064
62.6%
jan 1, 2005
0.238
+0.07
42.02%
jan 1, 2006
0.35
+0.112
47.2%
jan 1, 2007
0.308
-0.042
-11.99%
jan 1, 2008
0.401
+0.093
30.17%
jan 1, 2009
0.361
-0.04
-10.07%
jan 1, 2010
0.602
+0.241
66.79%
jan 1, 2011
0.664
+0.062
10.31%
jan 1, 2012
0.581
-0.083
-12.43%
jan 1, 2013
1.345
+0.763
131.32%
jan 1, 2014
3.967
+2.622
195.0%
jan 1, 2015
0.362
-3.605
-90.88%
Ranking of countries by current statistics by years


Comments: