29
/
en
AIzaSyAYiBZKx7MnpbEhh9jyipgxe19OcubqV5w
April 1, 2024
275947
United Kingdom
GBR
true
2
1
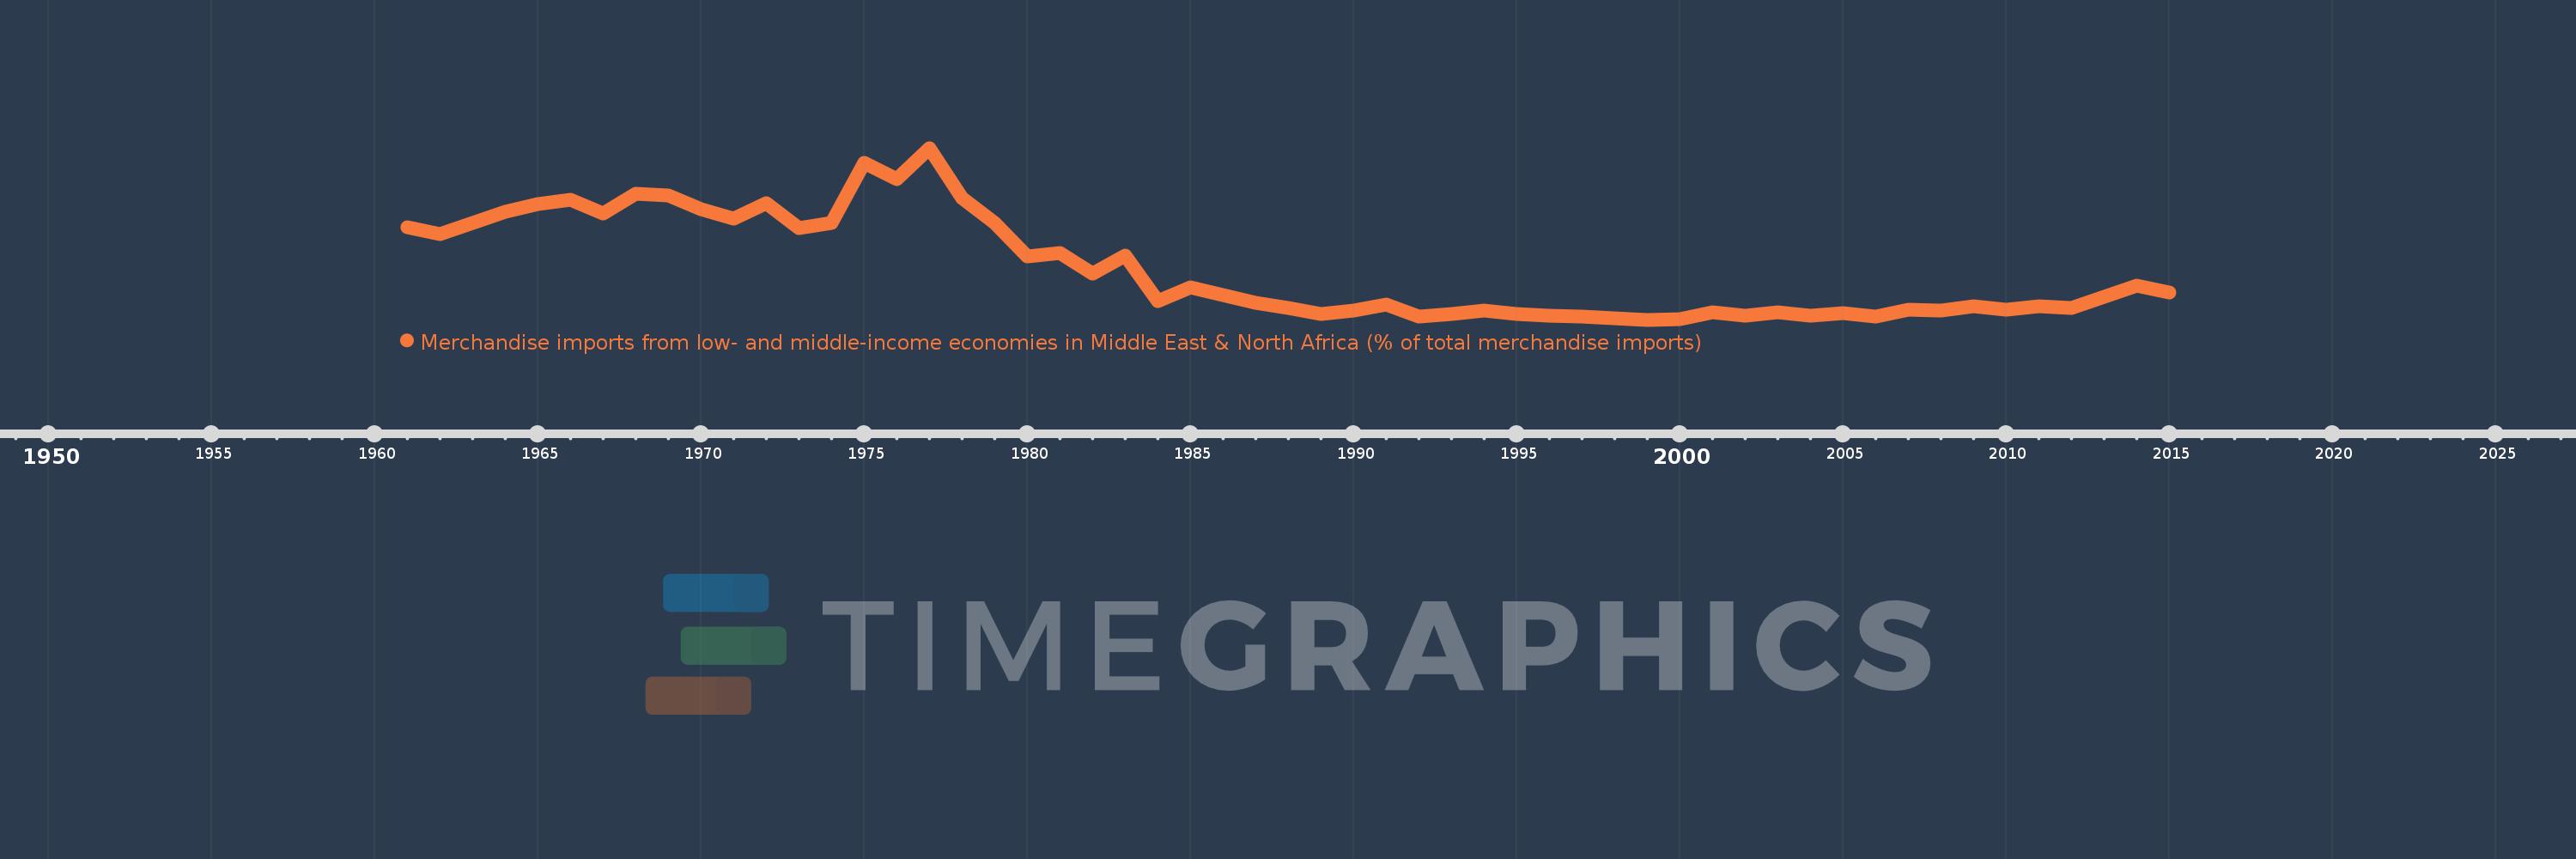
Merchandise imports from low- and middle-income economies in Middle East & North Africa (% of total merchandise imports)
2015,2014,2013,2012,2011,2010,2009,2008,2007,2006,2005,2004,2003,2002,2001,2000,1999,1998,1997,1996,1995,1994,1993,1992,1991,1990,1989,1988,1987,1986,1985,1984,1983,1982,1981,1980,1979,1978,1977,1976,1975,1974,1973,1972,1971,1970,1969,1968,1967,1966,1965,1964,1963,1962,1961
This statistics in other country:
AfghanistanAlbaniaAlgeriaAngolaArab WorldArgentinaArmeniaArubaAustraliaAustriaAzerbaijanBahamas, TheBahrainBangladeshBarbadosBelarusBelgiumBelizeBeninBermudaBoliviaBosnia and HerzegovinaBrazilBrunei DarussalamBulgariaBurkina FasoBurundiCabo VerdeCambodiaCameroonCanadaCaribbean small statesCentral African RepublicCentral Europe and the BalticsChadChileChinaColombiaComorosCongo, Dem. Rep.Congo, Rep.Costa RicaCote d'IvoireCroatiaCubaCyprusCzech RepublicDenmarkDjiboutiDominicaDominican RepublicEarly-demographic dividendEast Asia & PacificEast Asia & Pacific (excluding high income)East Asia & Pacific (IDA & IBRD countries)EcuadorEgypt, Arab Rep.El SalvadorEstoniaEthiopiaEuro areaEurope & Central AsiaEurope & Central Asia (excluding high income)Europe & Central Asia (IDA & IBRD countries)European UnionFijiFinlandFragile and conflict affected situationsFranceFrench PolynesiaGabonGambia, TheGeorgiaGermanyGhanaGreeceGreenlandGrenadaGuatemalaGuineaGuinea-BissauGuyanaHaitiHeavily indebted poor countries (HIPC)High incomeHondurasHong Kong SAR, ChinaHungaryIBRD onlyIcelandIDA & IBRD totalIDA blendIDA onlyIDA totalIndiaIndonesiaIran, Islamic Rep.IraqIrelandIsraelItalyJamaicaJapanJordanKazakhstanKenyaKorea, Dem. People’s Rep.Korea, Rep.KosovoKuwaitKyrgyz RepublicLao PDRLate-demographic dividendLatin America & Caribbean Latin America & Caribbean (excluding high income)Latin America & the Caribbean (IDA & IBRD countries)LatviaLeast developed countries: UN classificationLebanonLiberiaLibyaLithuaniaLow & middle incomeLow incomeLower middle incomeLuxembourgMacao SAR, ChinaMacedonia, FYRMadagascarMalawiMalaysiaMaldivesMaliMaltaMauritaniaMauritiusMexicoMiddle East & North AfricaMiddle East & North Africa (excluding high income)Middle East & North Africa (IDA & IBRD countries)Middle incomeMoldovaMongoliaMontenegroMoroccoMozambiqueMyanmarNepalNetherlandsNew CaledoniaNew ZealandNicaraguaNigerNigeriaNorth AmericaNorwayOECD membersOmanOther small statesPacific island small statesPakistanPanamaPapua New GuineaParaguayPeruPhilippinesPolandPortugalPost-demographic dividendPre-demographic dividendQatarRomaniaRussian FederationRwandaSamoaSaudi ArabiaSenegalSerbiaSeychellesSierra LeoneSingaporeSlovak RepublicSloveniaSmall statesSomaliaSouth AfricaSouth AsiaSouth Asia (IDA & IBRD)SpainSri LankaSt. Kitts and NevisSt. LuciaSt. Vincent and the GrenadinesSub-Saharan Africa Sub-Saharan Africa (excluding high income)Sub-Saharan Africa (IDA & IBRD countries)SudanSurinameSwedenSwitzerlandSyrian Arab RepublicTajikistanTanzaniaThailandTogoTrinidad and TobagoTunisiaTurkeyTurkmenistanUgandaUkraineUnited Arab EmiratesUnited KingdomUnited StatesUpper middle incomeUruguayUzbekistanVenezuela, RBVietnamWorldYemen, Rep.ZambiaZimbabwe Timeline:
This timeline shows a graph from 1961 to 2015 of United Kingdom. No data until 1960. Number of actual observations by date: 55.
Source name:
World Development Indicators
Source organization:
World Bank staff estimates based data from International Monetary Fund's Direction of Trade database.
Categories, topics:
Private Sector, Trade
Last updated:
apr 23, 2017
Indicators value changes by year
At the date of observation
Value
Absolute change
Change from previous value
jan 1, 1961
3.234
+3.234
0.0%
jan 1, 1962
3.038
-0.195
-6.04%
jan 1, 1963
3.365
+0.327
10.77%
jan 1, 1964
3.675
+0.309
9.19%
jan 1, 1965
3.898
+0.224
6.08%
jan 1, 1966
4.036
+0.137
3.53%
jan 1, 1967
3.645
-0.39
-9.68%
jan 1, 1968
4.199
+0.554
15.2%
jan 1, 1969
4.165
-0.034
-0.82%
jan 1, 1970
3.751
-0.414
-9.93%
jan 1, 1971
3.494
-0.257
-6.86%
jan 1, 1972
3.943
+0.45
12.87%
jan 1, 1973
3.225
-0.719
-18.23%
jan 1, 1974
3.359
+0.134
4.16%
jan 1, 1975
5.084
+1.725
51.36%
jan 1, 1976
4.629
-0.454
-8.94%
jan 1, 1977
5.517
+0.887
19.17%
jan 1, 1978
4.069
-1.448
-26.25%
jan 1, 1979
3.371
-0.697
-17.14%
jan 1, 1980
2.402
-0.969
-28.76%
jan 1, 1981
2.503
+0.101
4.22%
jan 1, 1982
1.918
-0.585
-23.38%
jan 1, 1983
2.431
+0.513
26.74%
jan 1, 1984
1.135
-1.296
-53.32%
jan 1, 1985
1.508
+0.373
32.9%
jan 1, 1986
1.287
-0.222
-14.69%
jan 1, 1987
1.081
-0.205
-15.96%
jan 1, 1988
0.933
-0.148
-13.71%
jan 1, 1989
0.752
-0.181
-19.35%
jan 1, 1990
0.849
+0.097
12.88%
jan 1, 1991
1.033
+0.184
21.67%
jan 1, 1992
0.681
-0.352
-34.1%
jan 1, 1993
0.746
+0.065
9.57%
jan 1, 1994
0.846
+0.1
13.4%
jan 1, 1995
0.744
-0.102
-12.08%
jan 1, 1996
0.711
-0.033
-4.42%
jan 1, 1997
0.692
-0.019
-2.64%
jan 1, 1998
0.636
-0.056
-8.11%
jan 1, 1999
0.589
-0.047
-7.34%
jan 1, 2000
0.602
+0.012
2.11%
jan 1, 2001
0.806
+0.204
33.9%
jan 1, 2002
0.704
-0.102
-12.67%
jan 1, 2003
0.792
+0.088
12.56%
jan 1, 2004
0.697
-0.095
-12.03%
jan 1, 2005
0.786
+0.089
12.81%
jan 1, 2006
0.672
-0.115
-14.57%
jan 1, 2007
0.883
+0.211
31.45%
jan 1, 2008
0.86
-0.022
-2.54%
jan 1, 2009
0.976
+0.116
13.48%
jan 1, 2010
0.872
-0.104
-10.69%
jan 1, 2011
0.976
+0.104
11.96%
jan 1, 2012
0.937
-0.04
-4.08%
jan 1, 2013
1.258
+0.321
34.3%
jan 1, 2014
1.576
+0.319
25.34%
jan 1, 2015
1.36
-0.216
-13.72%
Ranking of countries by current statistics by years


Comments: