29
/
en
AIzaSyAYiBZKx7MnpbEhh9jyipgxe19OcubqV5w
April 1, 2024
29287
East Asia & Pacific (IDA & IBRD countries)
TEA
false
2
1
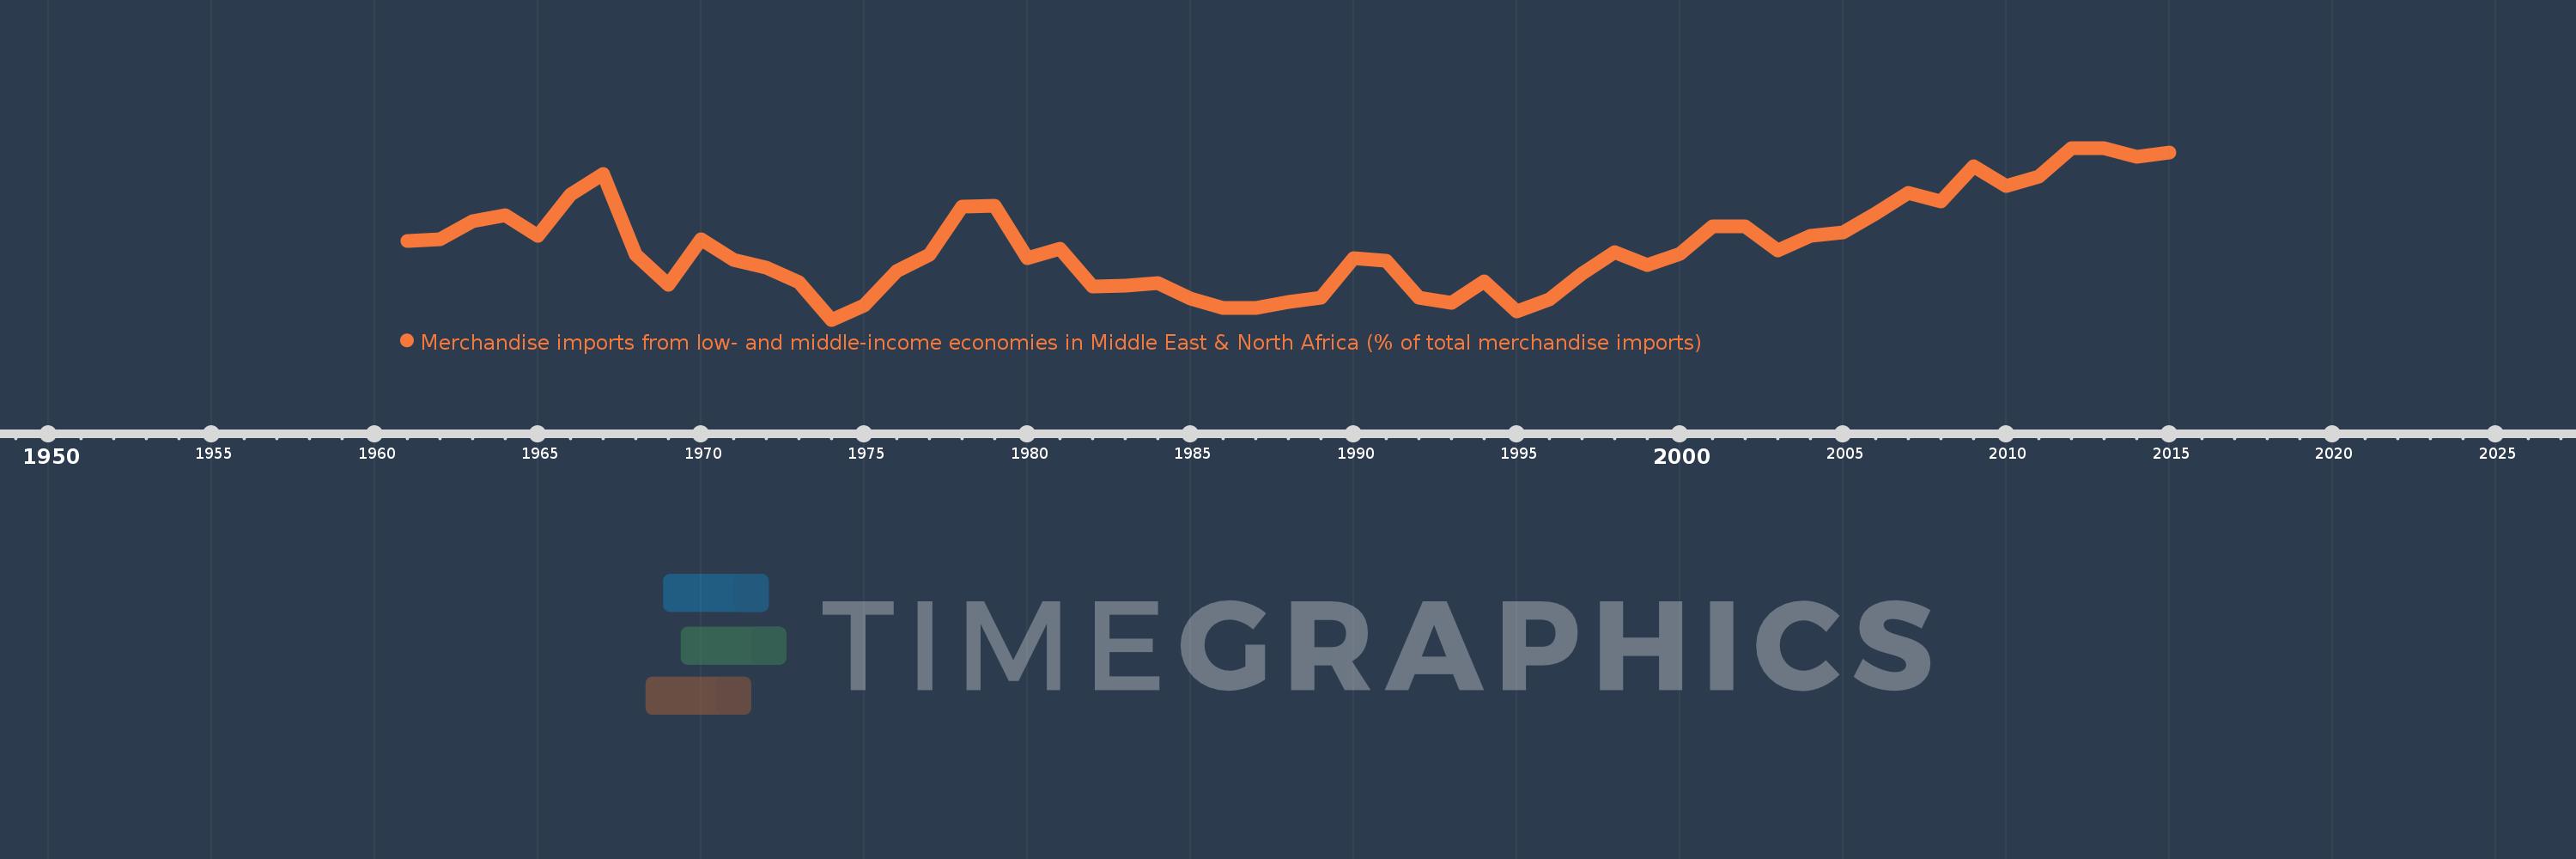
Merchandise imports from low- and middle-income economies in Middle East & North Africa (% of total merchandise imports)
2015,2014,2013,2012,2011,2010,2009,2008,2007,2006,2005,2004,2003,2002,2001,2000,1999,1998,1997,1996,1995,1994,1993,1992,1991,1990,1989,1988,1987,1986,1985,1984,1983,1982,1981,1980,1979,1978,1977,1976,1975,1974,1973,1972,1971,1970,1969,1968,1967,1966,1965,1964,1963,1962,1961
This statistics in other country:
AfghanistanAlbaniaAlgeriaAngolaArab WorldArgentinaArmeniaArubaAustraliaAustriaAzerbaijanBahamas, TheBahrainBangladeshBarbadosBelarusBelgiumBelizeBeninBermudaBoliviaBosnia and HerzegovinaBrazilBrunei DarussalamBulgariaBurkina FasoBurundiCabo VerdeCambodiaCameroonCanadaCaribbean small statesCentral African RepublicCentral Europe and the BalticsChadChileChinaColombiaComorosCongo, Dem. Rep.Congo, Rep.Costa RicaCote d'IvoireCroatiaCubaCyprusCzech RepublicDenmarkDjiboutiDominicaDominican RepublicEarly-demographic dividendEast Asia & PacificEast Asia & Pacific (excluding high income)East Asia & Pacific (IDA & IBRD countries)EcuadorEgypt, Arab Rep.El SalvadorEstoniaEthiopiaEuro areaEurope & Central AsiaEurope & Central Asia (excluding high income)Europe & Central Asia (IDA & IBRD countries)European UnionFijiFinlandFragile and conflict affected situationsFranceFrench PolynesiaGabonGambia, TheGeorgiaGermanyGhanaGreeceGreenlandGrenadaGuatemalaGuineaGuinea-BissauGuyanaHaitiHeavily indebted poor countries (HIPC)High incomeHondurasHong Kong SAR, ChinaHungaryIBRD onlyIcelandIDA & IBRD totalIDA blendIDA onlyIDA totalIndiaIndonesiaIran, Islamic Rep.IraqIrelandIsraelItalyJamaicaJapanJordanKazakhstanKenyaKorea, Dem. People’s Rep.Korea, Rep.KosovoKuwaitKyrgyz RepublicLao PDRLate-demographic dividendLatin America & Caribbean Latin America & Caribbean (excluding high income)Latin America & the Caribbean (IDA & IBRD countries)LatviaLeast developed countries: UN classificationLebanonLiberiaLibyaLithuaniaLow & middle incomeLow incomeLower middle incomeLuxembourgMacao SAR, ChinaMacedonia, FYRMadagascarMalawiMalaysiaMaldivesMaliMaltaMauritaniaMauritiusMexicoMiddle East & North AfricaMiddle East & North Africa (excluding high income)Middle East & North Africa (IDA & IBRD countries)Middle incomeMoldovaMongoliaMontenegroMoroccoMozambiqueMyanmarNepalNetherlandsNew CaledoniaNew ZealandNicaraguaNigerNigeriaNorth AmericaNorwayOECD membersOmanOther small statesPacific island small statesPakistanPanamaPapua New GuineaParaguayPeruPhilippinesPolandPortugalPost-demographic dividendPre-demographic dividendQatarRomaniaRussian FederationRwandaSamoaSaudi ArabiaSenegalSerbiaSeychellesSierra LeoneSingaporeSlovak RepublicSloveniaSmall statesSomaliaSouth AfricaSouth AsiaSouth Asia (IDA & IBRD)SpainSri LankaSt. Kitts and NevisSt. LuciaSt. Vincent and the GrenadinesSub-Saharan Africa Sub-Saharan Africa (excluding high income)Sub-Saharan Africa (IDA & IBRD countries)SudanSurinameSwedenSwitzerlandSyrian Arab RepublicTajikistanTanzaniaThailandTogoTrinidad and TobagoTunisiaTurkeyTurkmenistanUgandaUkraineUnited Arab EmiratesUnited KingdomUnited StatesUpper middle incomeUruguayUzbekistanVenezuela, RBVietnamWorldYemen, Rep.ZambiaZimbabwe Timeline:
This timeline shows a graph from 1961 to 2015 of East Asia & Pacific (IDA & IBRD countries). No data until 1960. Number of actual observations by date: 55.
Source name:
World Development Indicators
Source organization:
World Bank staff estimates based data from International Monetary Fund's Direction of Trade database.
Categories, topics:
Private Sector, Trade
Last updated:
apr 23, 2017
Indicators value changes by year
At the date of observation
Value
Absolute change
Change from previous value
jan 1, 1961
1.157
+1.157
0.0%
jan 1, 1962
1.178
+0.021
1.79%
jan 1, 1963
1.383
+0.205
17.37%
jan 1, 1964
1.45
+0.067
4.86%
jan 1, 1965
1.222
-0.228
-15.72%
jan 1, 1966
1.679
+0.457
37.39%
jan 1, 1967
1.912
+0.234
13.92%
jan 1, 1968
1.002
-0.91
-47.59%
jan 1, 1969
0.664
-0.339
-33.8%
jan 1, 1970
1.185
+0.521
78.56%
jan 1, 1971
0.947
-0.238
-20.1%
jan 1, 1972
0.862
-0.085
-8.96%
jan 1, 1973
0.698
-0.164
-18.97%
jan 1, 1974
0.275
-0.424
-60.67%
jan 1, 1975
0.434
+0.159
57.95%
jan 1, 1976
0.826
+0.392
90.41%
jan 1, 1977
1.011
+0.185
22.45%
jan 1, 1978
1.546
+0.534
52.82%
jan 1, 1979
1.562
+0.016
1.04%
jan 1, 1980
0.97
-0.592
-37.89%
jan 1, 1981
1.073
+0.103
10.59%
jan 1, 1982
0.653
-0.42
-39.14%
jan 1, 1983
0.661
+0.008
1.2%
jan 1, 1984
0.688
+0.027
4.09%
jan 1, 1985
0.516
-0.172
-24.98%
jan 1, 1986
0.411
-0.105
-20.28%
jan 1, 1987
0.404
-0.008
-1.86%
jan 1, 1988
0.475
+0.072
17.72%
jan 1, 1989
0.521
+0.046
9.74%
jan 1, 1990
0.968
+0.446
85.57%
jan 1, 1991
0.937
-0.03
-3.13%
jan 1, 1992
0.524
-0.414
-44.13%
jan 1, 1993
0.462
-0.062
-11.81%
jan 1, 1994
0.706
+0.244
52.92%
jan 1, 1995
0.364
-0.342
-48.4%
jan 1, 1996
0.501
+0.136
37.39%
jan 1, 1997
0.796
+0.296
59.01%
jan 1, 1998
1.036
+0.24
30.12%
jan 1, 1999
0.89
-0.146
-14.07%
jan 1, 2000
1.012
+0.122
13.65%
jan 1, 2001
1.33
+0.318
31.46%
jan 1, 2002
1.325
-0.006
-0.42%
jan 1, 2003
1.051
-0.273
-20.63%
jan 1, 2004
1.223
+0.172
16.34%
jan 1, 2005
1.26
+0.037
3.06%
jan 1, 2006
1.467
+0.206
16.35%
jan 1, 2007
1.701
+0.234
15.98%
jan 1, 2008
1.607
-0.094
-5.54%
jan 1, 2009
2.005
+0.398
24.78%
jan 1, 2010
1.781
-0.224
-11.16%
jan 1, 2011
1.883
+0.102
5.73%
jan 1, 2012
2.208
+0.325
17.24%
jan 1, 2013
2.202
-0.006
-0.28%
jan 1, 2014
2.109
-0.093
-4.22%
jan 1, 2015
2.157
+0.049
2.3%
Ranking of countries by current statistics by years


Comments: