29
/
en
AIzaSyAYiBZKx7MnpbEhh9jyipgxe19OcubqV5w
April 1, 2024
24300
Arab World
ARB
false
2
1
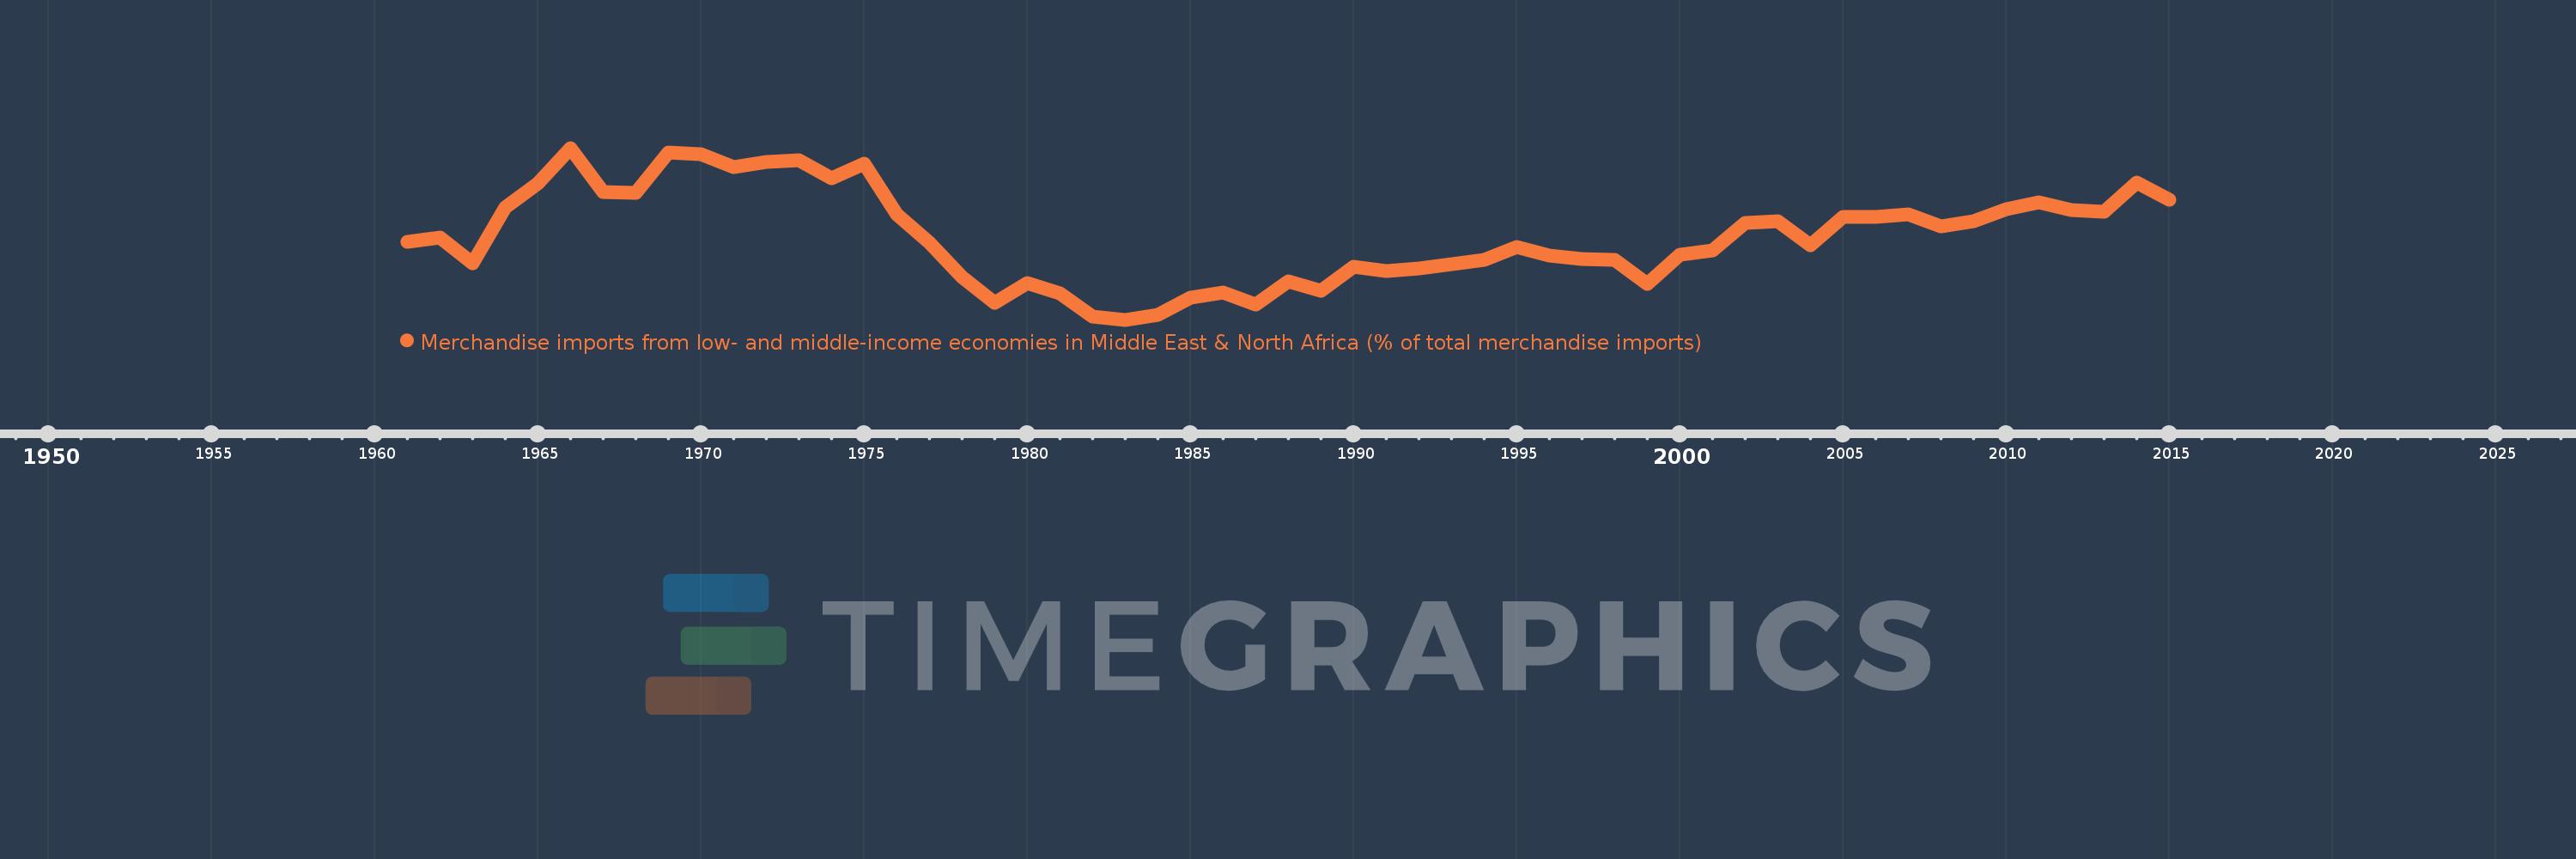
Merchandise imports from low- and middle-income economies in Middle East & North Africa (% of total merchandise imports)
2015,2014,2013,2012,2011,2010,2009,2008,2007,2006,2005,2004,2003,2002,2001,2000,1999,1998,1997,1996,1995,1994,1993,1992,1991,1990,1989,1988,1987,1986,1985,1984,1983,1982,1981,1980,1979,1978,1977,1976,1975,1974,1973,1972,1971,1970,1969,1968,1967,1966,1965,1964,1963,1962,1961
This statistics in other country:
AfghanistanAlbaniaAlgeriaAngolaArab WorldArgentinaArmeniaArubaAustraliaAustriaAzerbaijanBahamas, TheBahrainBangladeshBarbadosBelarusBelgiumBelizeBeninBermudaBoliviaBosnia and HerzegovinaBrazilBrunei DarussalamBulgariaBurkina FasoBurundiCabo VerdeCambodiaCameroonCanadaCaribbean small statesCentral African RepublicCentral Europe and the BalticsChadChileChinaColombiaComorosCongo, Dem. Rep.Congo, Rep.Costa RicaCote d'IvoireCroatiaCubaCyprusCzech RepublicDenmarkDjiboutiDominicaDominican RepublicEarly-demographic dividendEast Asia & PacificEast Asia & Pacific (excluding high income)East Asia & Pacific (IDA & IBRD countries)EcuadorEgypt, Arab Rep.El SalvadorEstoniaEthiopiaEuro areaEurope & Central AsiaEurope & Central Asia (excluding high income)Europe & Central Asia (IDA & IBRD countries)European UnionFijiFinlandFragile and conflict affected situationsFranceFrench PolynesiaGabonGambia, TheGeorgiaGermanyGhanaGreeceGreenlandGrenadaGuatemalaGuineaGuinea-BissauGuyanaHaitiHeavily indebted poor countries (HIPC)High incomeHondurasHong Kong SAR, ChinaHungaryIBRD onlyIcelandIDA & IBRD totalIDA blendIDA onlyIDA totalIndiaIndonesiaIran, Islamic Rep.IraqIrelandIsraelItalyJamaicaJapanJordanKazakhstanKenyaKorea, Dem. People’s Rep.Korea, Rep.KosovoKuwaitKyrgyz RepublicLao PDRLate-demographic dividendLatin America & Caribbean Latin America & Caribbean (excluding high income)Latin America & the Caribbean (IDA & IBRD countries)LatviaLeast developed countries: UN classificationLebanonLiberiaLibyaLithuaniaLow & middle incomeLow incomeLower middle incomeLuxembourgMacao SAR, ChinaMacedonia, FYRMadagascarMalawiMalaysiaMaldivesMaliMaltaMauritaniaMauritiusMexicoMiddle East & North AfricaMiddle East & North Africa (excluding high income)Middle East & North Africa (IDA & IBRD countries)Middle incomeMoldovaMongoliaMontenegroMoroccoMozambiqueMyanmarNepalNetherlandsNew CaledoniaNew ZealandNicaraguaNigerNigeriaNorth AmericaNorwayOECD membersOmanOther small statesPacific island small statesPakistanPanamaPapua New GuineaParaguayPeruPhilippinesPolandPortugalPost-demographic dividendPre-demographic dividendQatarRomaniaRussian FederationRwandaSamoaSaudi ArabiaSenegalSerbiaSeychellesSierra LeoneSingaporeSlovak RepublicSloveniaSmall statesSomaliaSouth AfricaSouth AsiaSouth Asia (IDA & IBRD)SpainSri LankaSt. Kitts and NevisSt. LuciaSt. Vincent and the GrenadinesSub-Saharan Africa Sub-Saharan Africa (excluding high income)Sub-Saharan Africa (IDA & IBRD countries)SudanSurinameSwedenSwitzerlandSyrian Arab RepublicTajikistanTanzaniaThailandTogoTrinidad and TobagoTunisiaTurkeyTurkmenistanUgandaUkraineUnited Arab EmiratesUnited KingdomUnited StatesUpper middle incomeUruguayUzbekistanVenezuela, RBVietnamWorldYemen, Rep.ZambiaZimbabwe Timeline:
This timeline shows a graph from 1961 to 2015 of Arab World. No data until 1960. Number of actual observations by date: 55.
Source name:
World Development Indicators
Source organization:
World Bank staff estimates based data from International Monetary Fund's Direction of Trade database.
Categories, topics:
Private Sector, Trade
Last updated:
apr 23, 2017
Indicators value changes by year
At the date of observation
Value
Absolute change
Change from previous value
jan 1, 1961
4.742
+4.742
0.0%
jan 1, 1962
4.867
+0.126
2.65%
jan 1, 1963
4.068
-0.799
-16.41%
jan 1, 1964
5.8
+1.731
42.56%
jan 1, 1965
6.541
+0.742
12.79%
jan 1, 1966
7.653
+1.111
16.99%
jan 1, 1967
6.276
-1.377
-18.0%
jan 1, 1968
6.267
-0.008
-0.13%
jan 1, 1969
7.506
+1.239
19.76%
jan 1, 1970
7.448
-0.058
-0.77%
jan 1, 1971
7.051
-0.397
-5.33%
jan 1, 1972
7.219
+0.168
2.38%
jan 1, 1973
7.267
+0.047
0.66%
jan 1, 1974
6.701
-0.566
-7.78%
jan 1, 1975
7.159
+0.458
6.83%
jan 1, 1976
5.604
-1.555
-21.72%
jan 1, 1977
4.707
-0.897
-16.0%
jan 1, 1978
3.664
-1.044
-22.17%
jan 1, 1979
2.856
-0.807
-22.04%
jan 1, 1980
3.459
+0.603
21.11%
jan 1, 1981
3.148
-0.311
-8.99%
jan 1, 1982
2.431
-0.717
-22.77%
jan 1, 1983
2.332
-0.1
-4.1%
jan 1, 1984
2.492
+0.16
6.88%
jan 1, 1985
3.029
+0.537
21.55%
jan 1, 1986
3.174
+0.145
4.79%
jan 1, 1987
2.8
-0.374
-11.78%
jan 1, 1988
3.528
+0.728
26.0%
jan 1, 1989
3.216
-0.313
-8.87%
jan 1, 1990
3.975
+0.759
23.61%
jan 1, 1991
3.853
-0.121
-3.05%
jan 1, 1992
3.932
+0.078
2.03%
jan 1, 1993
4.05
+0.118
3.01%
jan 1, 1994
4.191
+0.141
3.48%
jan 1, 1995
4.579
+0.388
9.25%
jan 1, 1996
4.312
-0.267
-5.83%
jan 1, 1997
4.207
-0.105
-2.42%
jan 1, 1998
4.176
-0.032
-0.75%
jan 1, 1999
3.433
-0.743
-17.78%
jan 1, 2000
4.345
+0.912
26.57%
jan 1, 2001
4.472
+0.126
2.9%
jan 1, 2002
5.342
+0.87
19.47%
jan 1, 2003
5.392
+0.051
0.95%
jan 1, 2004
4.645
-0.747
-13.86%
jan 1, 2005
5.505
+0.859
18.5%
jan 1, 2006
5.524
+0.02
0.36%
jan 1, 2007
5.592
+0.068
1.23%
jan 1, 2008
5.219
-0.373
-6.67%
jan 1, 2009
5.382
+0.163
3.12%
jan 1, 2010
5.757
+0.376
6.98%
jan 1, 2011
5.963
+0.206
3.57%
jan 1, 2012
5.723
-0.24
-4.02%
jan 1, 2013
5.666
-0.057
-0.99%
jan 1, 2014
6.577
+0.911
16.08%
jan 1, 2015
6.039
-0.539
-8.19%
Ranking of countries by current statistics by years


Comments: