29
/
en
AIzaSyAYiBZKx7MnpbEhh9jyipgxe19OcubqV5w
April 1, 2024
73729
Austria
AUT
true
2
1
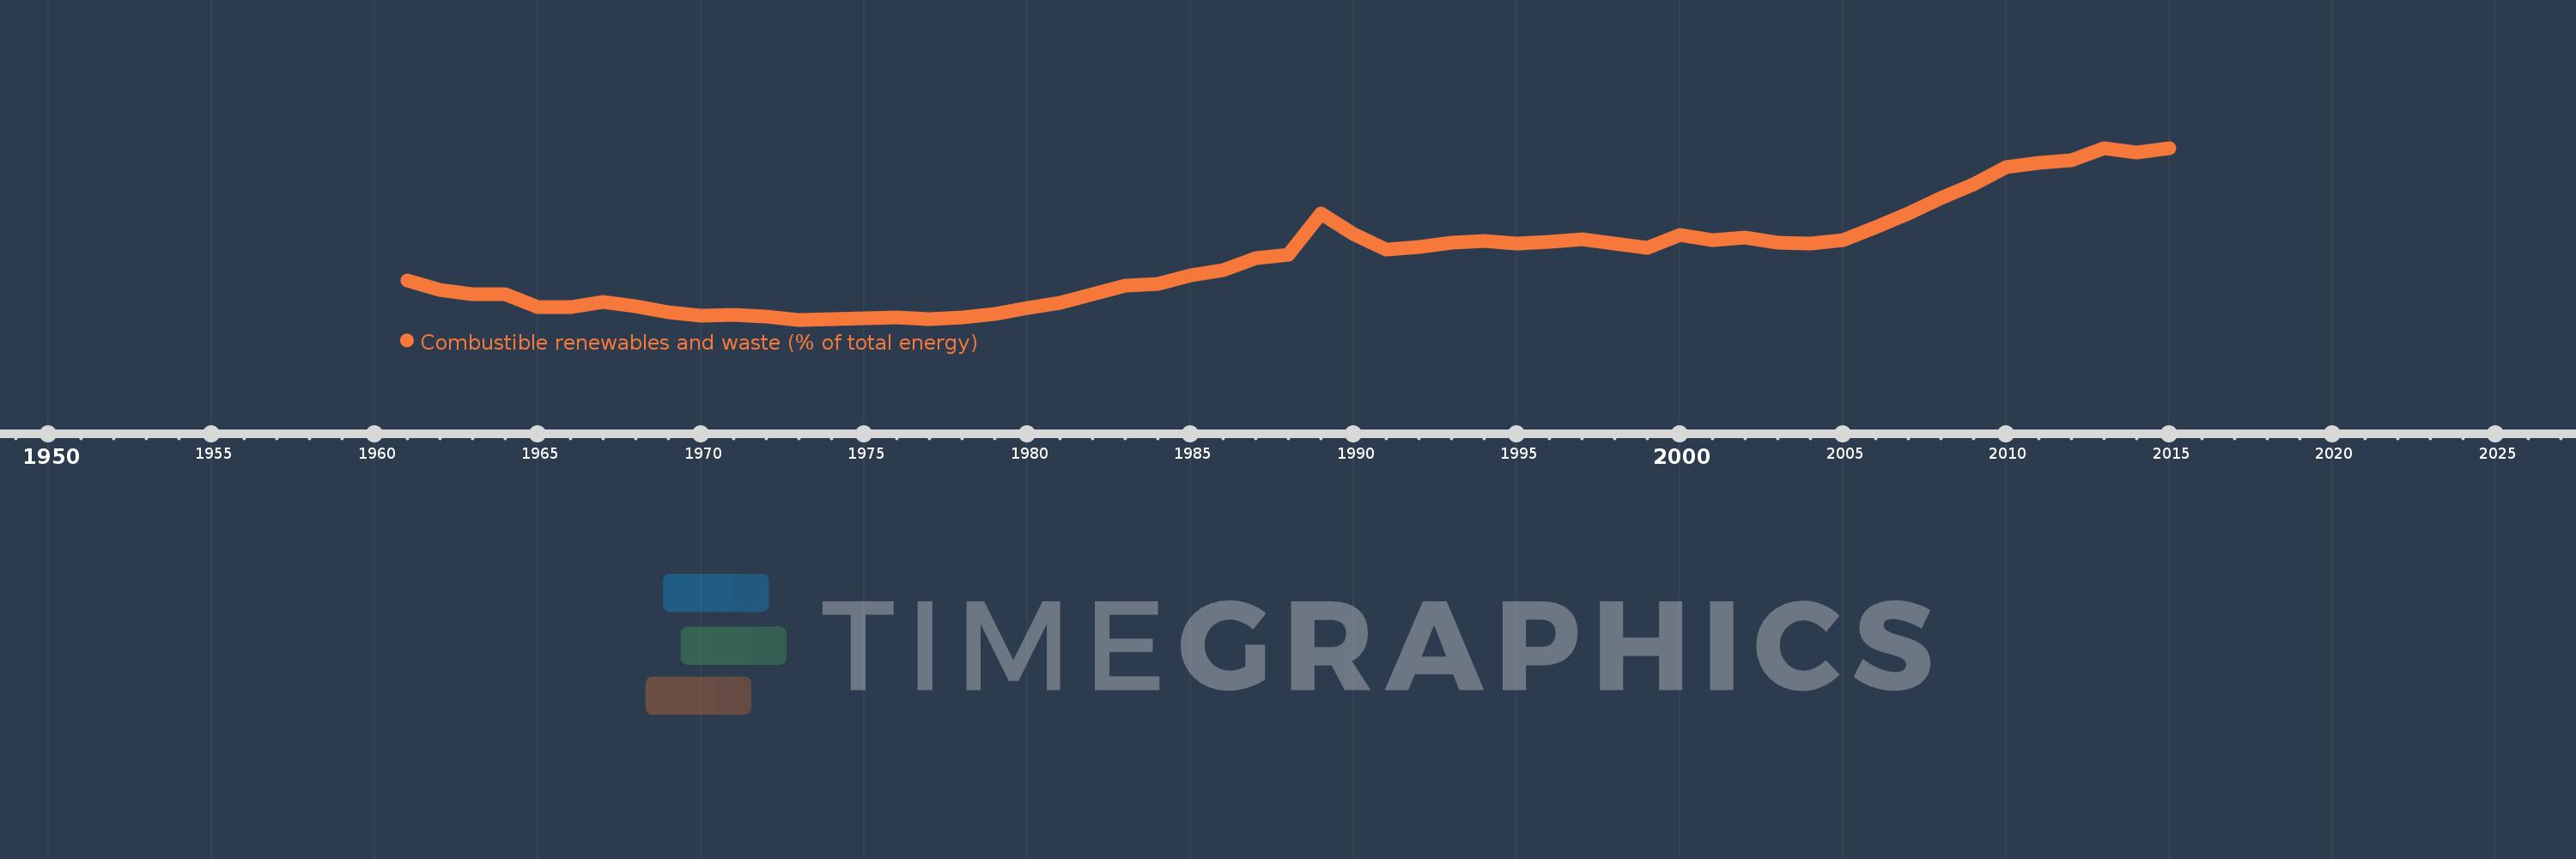
Combustible renewables and waste (% of total energy)
2015,2014,2013,2012,2011,2010,2009,2008,2007,2006,2005,2004,2003,2002,2001,2000,1999,1998,1997,1996,1995,1994,1993,1992,1991,1990,1989,1988,1987,1986,1985,1984,1983,1982,1981,1980,1979,1978,1977,1976,1975,1974,1973,1972,1971,1970,1969,1968,1967,1966,1965,1964,1963,1962,1961
This statistics in other country:
AlbaniaAlgeriaAngolaArab WorldArgentinaArmeniaAustraliaAustriaAzerbaijanBahrainBangladeshBelarusBelgiumBeninBoliviaBosnia and HerzegovinaBotswanaBrazilBrunei DarussalamBulgariaCambodiaCameroonCanadaCaribbean small statesCentral Europe and the BalticsChileChinaColombiaCongo, Dem. Rep.Congo, Rep.Costa RicaCote d'IvoireCroatiaCubaCuracaoCyprusCzech RepublicDenmarkDominican RepublicEarly-demographic dividendEast Asia & PacificEast Asia & Pacific (excluding high income)East Asia & Pacific (IDA & IBRD countries)EcuadorEgypt, Arab Rep.El SalvadorEritreaEstoniaEthiopiaEuro areaEurope & Central AsiaEurope & Central Asia (excluding high income)Europe & Central Asia (IDA & IBRD countries)European UnionFinlandFragile and conflict affected situationsFranceGabonGeorgiaGermanyGhanaGibraltarGreeceGuatemalaHaitiHeavily indebted poor countries (HIPC)High incomeHondurasHong Kong SAR, ChinaHungaryIBRD onlyIcelandIDA & IBRD totalIDA blendIDA onlyIDA totalIndiaIndonesiaIran, Islamic Rep.IraqIrelandIsraelItalyJamaicaJapanJordanKazakhstanKenyaKorea, Dem. People’s Rep.Korea, Rep.KosovoKuwaitKyrgyz RepublicLate-demographic dividendLatin America & Caribbean Latin America & Caribbean (excluding high income)Latin America & the Caribbean (IDA & IBRD countries)LatviaLeast developed countries: UN classificationLebanonLibyaLithuaniaLow & middle incomeLow incomeLower middle incomeLuxembourgMacedonia, FYRMalaysiaMaltaMauritiusMexicoMiddle East & North AfricaMiddle East & North Africa (excluding high income)Middle East & North Africa (IDA & IBRD countries)Middle incomeMoldovaMongoliaMontenegroMoroccoMozambiqueMyanmarNamibiaNepalNetherlandsNew ZealandNicaraguaNigerNigeriaNorth AmericaNorwayOECD membersOmanOther small statesPakistanPanamaParaguayPeruPhilippinesPolandPortugalPost-demographic dividendPre-demographic dividendQatarRomaniaRussian FederationSaudi ArabiaSenegalSerbiaSingaporeSlovak RepublicSloveniaSmall statesSouth AfricaSouth AsiaSouth Asia (IDA & IBRD)South SudanSpainSri LankaSub-Saharan Africa Sub-Saharan Africa (excluding high income)Sub-Saharan Africa (IDA & IBRD countries)SudanSwedenSwitzerlandSyrian Arab RepublicTajikistanTanzaniaThailandTogoTrinidad and TobagoTunisiaTurkeyTurkmenistanUkraineUnited Arab EmiratesUnited KingdomUnited StatesUpper middle incomeUruguayUzbekistanVenezuela, RBVietnamWorldYemen, Rep.ZambiaZimbabwe Timeline:
This timeline shows a graph from 1961 to 2015 of Austria. No data until 1960. Number of actual observations by date: 55.
Source name:
World Development Indicators
Source organization:
IEA Statistics © OECD/IEA 2014 (http://www.iea.org/stats/index.asp), subject to https://www.iea.org/t&c/termsandconditions/
Categories, topics:
Energy & Mining
Last updated:
apr 23, 2017
Indicators value changes by year
Maximum:
19.939
jan 1, 2013
At the date of observation
Value
Absolute change
Change from previous value
jan 1, 1961
7.097
+7.097
0.0%
jan 1, 1962
6.165
-0.932
-13.14%
jan 1, 1963
5.769
-0.395
-6.41%
jan 1, 1964
5.775
+0.005
0.09%
jan 1, 1965
4.491
-1.283
-22.22%
jan 1, 1966
4.47
-0.021
-0.47%
jan 1, 1967
4.948
+0.478
10.69%
jan 1, 1968
4.545
-0.403
-8.14%
jan 1, 1969
3.944
-0.601
-13.22%
jan 1, 1970
3.686
-0.258
-6.55%
jan 1, 1971
3.709
+0.023
0.61%
jan 1, 1972
3.577
-0.132
-3.56%
jan 1, 1973
3.257
-0.32
-8.95%
jan 1, 1974
3.337
+0.08
2.46%
jan 1, 1975
3.378
+0.041
1.24%
jan 1, 1976
3.51
+0.132
3.9%
jan 1, 1977
3.331
-0.179
-5.09%
jan 1, 1978
3.451
+0.12
3.59%
jan 1, 1979
3.846
+0.395
11.46%
jan 1, 1980
4.368
+0.522
13.57%
jan 1, 1981
4.911
+0.543
12.43%
jan 1, 1982
5.733
+0.822
16.73%
jan 1, 1983
6.603
+0.871
15.19%
jan 1, 1984
6.71
+0.107
1.62%
jan 1, 1985
7.557
+0.847
12.62%
jan 1, 1986
8.071
+0.513
6.79%
jan 1, 1987
9.247
+1.176
14.57%
jan 1, 1988
9.541
+0.293
3.17%
jan 1, 1989
13.597
+4.056
42.52%
jan 1, 1990
11.606
-1.991
-14.64%
jan 1, 1991
10.078
-1.528
-13.17%
jan 1, 1992
10.349
+0.271
2.69%
jan 1, 1993
10.714
+0.365
3.53%
jan 1, 1994
10.877
+0.162
1.52%
jan 1, 1995
10.616
-0.26
-2.39%
jan 1, 1996
10.792
+0.176
1.66%
jan 1, 1997
11.044
+0.252
2.33%
jan 1, 1998
10.666
-0.378
-3.42%
jan 1, 1999
10.216
-0.45
-4.22%
jan 1, 2000
11.487
+1.271
12.44%
jan 1, 2001
10.981
-0.506
-4.41%
jan 1, 2002
11.2
+0.219
1.99%
jan 1, 2003
10.729
-0.471
-4.21%
jan 1, 2004
10.646
-0.083
-0.77%
jan 1, 2005
10.956
+0.31
2.91%
jan 1, 2006
12.277
+1.321
12.06%
jan 1, 2007
13.591
+1.314
10.7%
jan 1, 2008
15.094
+1.503
11.06%
jan 1, 2009
16.379
+1.285
8.51%
jan 1, 2010
18.058
+1.679
10.25%
jan 1, 2011
18.5
+0.442
2.45%
jan 1, 2012
18.721
+0.222
1.2%
jan 1, 2013
19.939
+1.217
6.5%
jan 1, 2014
19.516
-0.422
-2.12%
jan 1, 2015
19.931
+0.415
2.13%
Ranking of countries by current statistics by years


Comments: