29
/
en
AIzaSyAYiBZKx7MnpbEhh9jyipgxe19OcubqV5w
April 1, 2024
83840
Benin
BEN
true
2
1
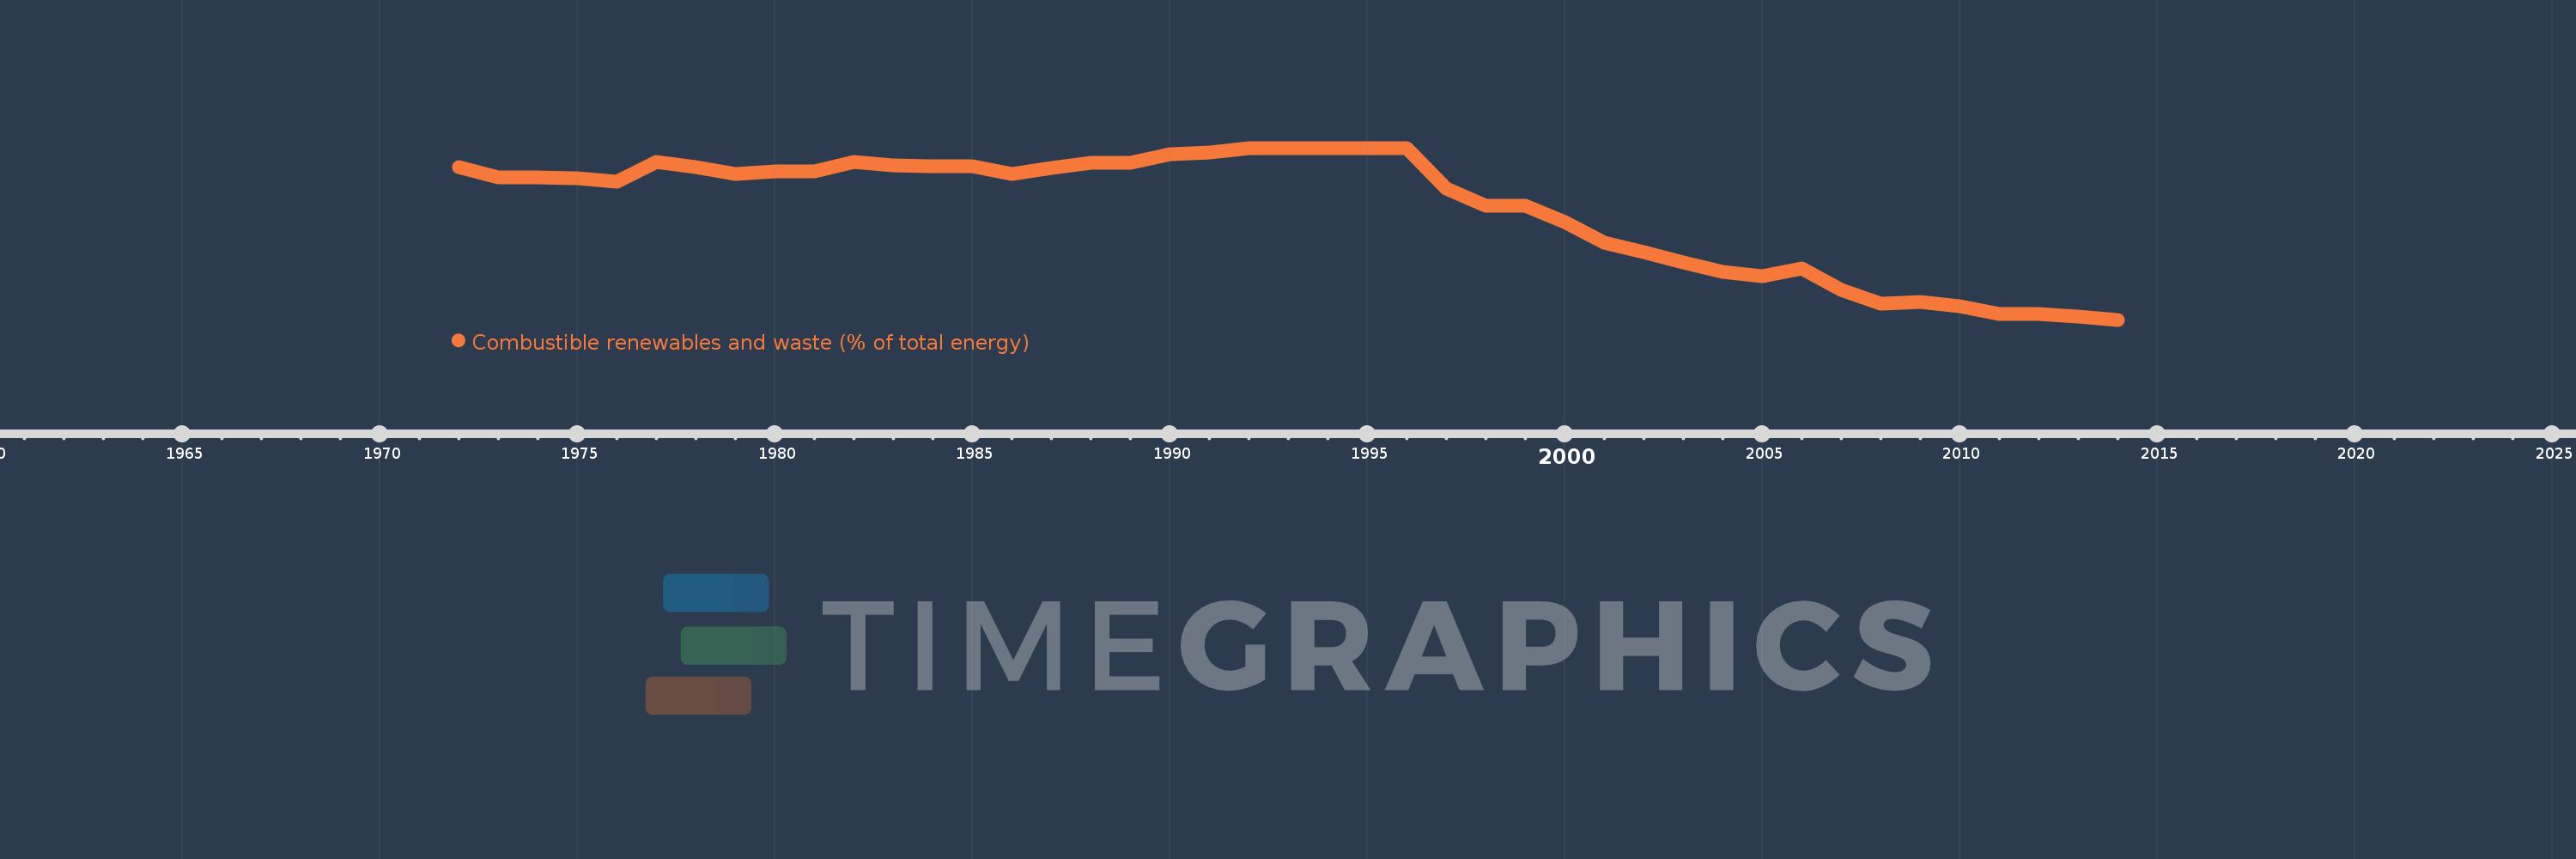
Combustible renewables and waste (% of total energy)
2014,2013,2012,2011,2010,2009,2008,2007,2006,2005,2004,2003,2002,2001,2000,1999,1998,1997,1996,1995,1994,1993,1992,1991,1990,1989,1988,1987,1986,1985,1984,1983,1982,1981,1980,1979,1978,1977,1976,1975,1974,1973,1972
This statistics in other country:
AlbaniaAlgeriaAngolaArab WorldArgentinaArmeniaAustraliaAustriaAzerbaijanBahrainBangladeshBelarusBelgiumBeninBoliviaBosnia and HerzegovinaBotswanaBrazilBrunei DarussalamBulgariaCambodiaCameroonCanadaCaribbean small statesCentral Europe and the BalticsChileChinaColombiaCongo, Dem. Rep.Congo, Rep.Costa RicaCote d'IvoireCroatiaCubaCuracaoCyprusCzech RepublicDenmarkDominican RepublicEarly-demographic dividendEast Asia & PacificEast Asia & Pacific (excluding high income)East Asia & Pacific (IDA & IBRD countries)EcuadorEgypt, Arab Rep.El SalvadorEritreaEstoniaEthiopiaEuro areaEurope & Central AsiaEurope & Central Asia (excluding high income)Europe & Central Asia (IDA & IBRD countries)European UnionFinlandFragile and conflict affected situationsFranceGabonGeorgiaGermanyGhanaGibraltarGreeceGuatemalaHaitiHeavily indebted poor countries (HIPC)High incomeHondurasHong Kong SAR, ChinaHungaryIBRD onlyIcelandIDA & IBRD totalIDA blendIDA onlyIDA totalIndiaIndonesiaIran, Islamic Rep.IraqIrelandIsraelItalyJamaicaJapanJordanKazakhstanKenyaKorea, Dem. People’s Rep.Korea, Rep.KosovoKuwaitKyrgyz RepublicLate-demographic dividendLatin America & Caribbean Latin America & Caribbean (excluding high income)Latin America & the Caribbean (IDA & IBRD countries)LatviaLeast developed countries: UN classificationLebanonLibyaLithuaniaLow & middle incomeLow incomeLower middle incomeLuxembourgMacedonia, FYRMalaysiaMaltaMauritiusMexicoMiddle East & North AfricaMiddle East & North Africa (excluding high income)Middle East & North Africa (IDA & IBRD countries)Middle incomeMoldovaMongoliaMontenegroMoroccoMozambiqueMyanmarNamibiaNepalNetherlandsNew ZealandNicaraguaNigerNigeriaNorth AmericaNorwayOECD membersOmanOther small statesPakistanPanamaParaguayPeruPhilippinesPolandPortugalPost-demographic dividendPre-demographic dividendQatarRomaniaRussian FederationSaudi ArabiaSenegalSerbiaSingaporeSlovak RepublicSloveniaSmall statesSouth AfricaSouth AsiaSouth Asia (IDA & IBRD)South SudanSpainSri LankaSub-Saharan Africa Sub-Saharan Africa (excluding high income)Sub-Saharan Africa (IDA & IBRD countries)SudanSwedenSwitzerlandSyrian Arab RepublicTajikistanTanzaniaThailandTogoTrinidad and TobagoTunisiaTurkeyTurkmenistanUkraineUnited Arab EmiratesUnited KingdomUnited StatesUpper middle incomeUruguayUzbekistanVenezuela, RBVietnamWorldYemen, Rep.ZambiaZimbabwe Timeline:
This timeline shows a graph from 1972 to 2014 of Benin. No data until 1971. Number of actual observations by date: 43.
Source name:
World Development Indicators
Source organization:
IEA Statistics © OECD/IEA 2014 (http://www.iea.org/stats/index.asp), subject to https://www.iea.org/t&c/termsandconditions/
Categories, topics:
Energy & Mining
Last updated:
apr 23, 2017
Indicators value changes by year
At the date of observation
Value
Absolute change
Change from previous value
jan 1, 1972
90.703
+90.703
0.0%
jan 1, 1973
88.303
-2.4
-2.65%
jan 1, 1974
88.186
-0.117
-0.13%
jan 1, 1975
88.049
-0.137
-0.16%
jan 1, 1976
87.304
-0.745
-0.85%
jan 1, 1977
91.862
+4.558
5.22%
jan 1, 1978
90.568
-1.294
-1.41%
jan 1, 1979
89.093
-1.475
-1.63%
jan 1, 1980
89.616
+0.523
0.59%
jan 1, 1981
89.577
-0.039
-0.04%
jan 1, 1982
91.861
+2.284
2.55%
jan 1, 1983
90.982
-0.879
-0.96%
jan 1, 1984
90.765
-0.218
-0.24%
jan 1, 1985
90.918
+0.154
0.17%
jan 1, 1986
89.018
-1.901
-2.09%
jan 1, 1987
90.505
+1.487
1.67%
jan 1, 1988
91.645
+1.14
1.26%
jan 1, 1989
91.697
+0.052
0.06%
jan 1, 1990
93.576
+1.879
2.05%
jan 1, 1991
94.146
+0.57
0.61%
jan 1, 1992
95.049
+0.903
0.96%
jan 1, 1993
95.004
-0.045
-0.05%
jan 1, 1994
95.032
+0.028
0.03%
jan 1, 1995
95.13
+0.099
0.1%
jan 1, 1996
95.027
-0.103
-0.11%
jan 1, 1997
85.612
-9.415
-9.91%
jan 1, 1998
81.576
-4.036
-4.71%
jan 1, 1999
81.665
+0.09
0.11%
jan 1, 2000
77.76
-3.905
-4.78%
jan 1, 2001
72.883
-4.878
-6.27%
jan 1, 2002
70.667
-2.216
-3.04%
jan 1, 2003
68.319
-2.348
-3.32%
jan 1, 2004
66.066
-2.253
-3.3%
jan 1, 2005
65.178
-0.888
-1.34%
jan 1, 2006
66.899
+1.721
2.64%
jan 1, 2007
61.957
-4.942
-7.39%
jan 1, 2008
58.778
-3.179
-5.13%
jan 1, 2009
59.187
+0.409
0.7%
jan 1, 2010
58.033
-1.155
-1.95%
jan 1, 2011
56.245
-1.788
-3.08%
jan 1, 2012
56.223
-0.022
-0.04%
jan 1, 2013
55.621
-0.602
-1.07%
jan 1, 2014
54.93
-0.691
-1.24%
Ranking of countries by current statistics by years


Comments: