29
/
en
AIzaSyAYiBZKx7MnpbEhh9jyipgxe19OcubqV5w
April 1, 2024
65775
Algeria
DZA
true
2
1
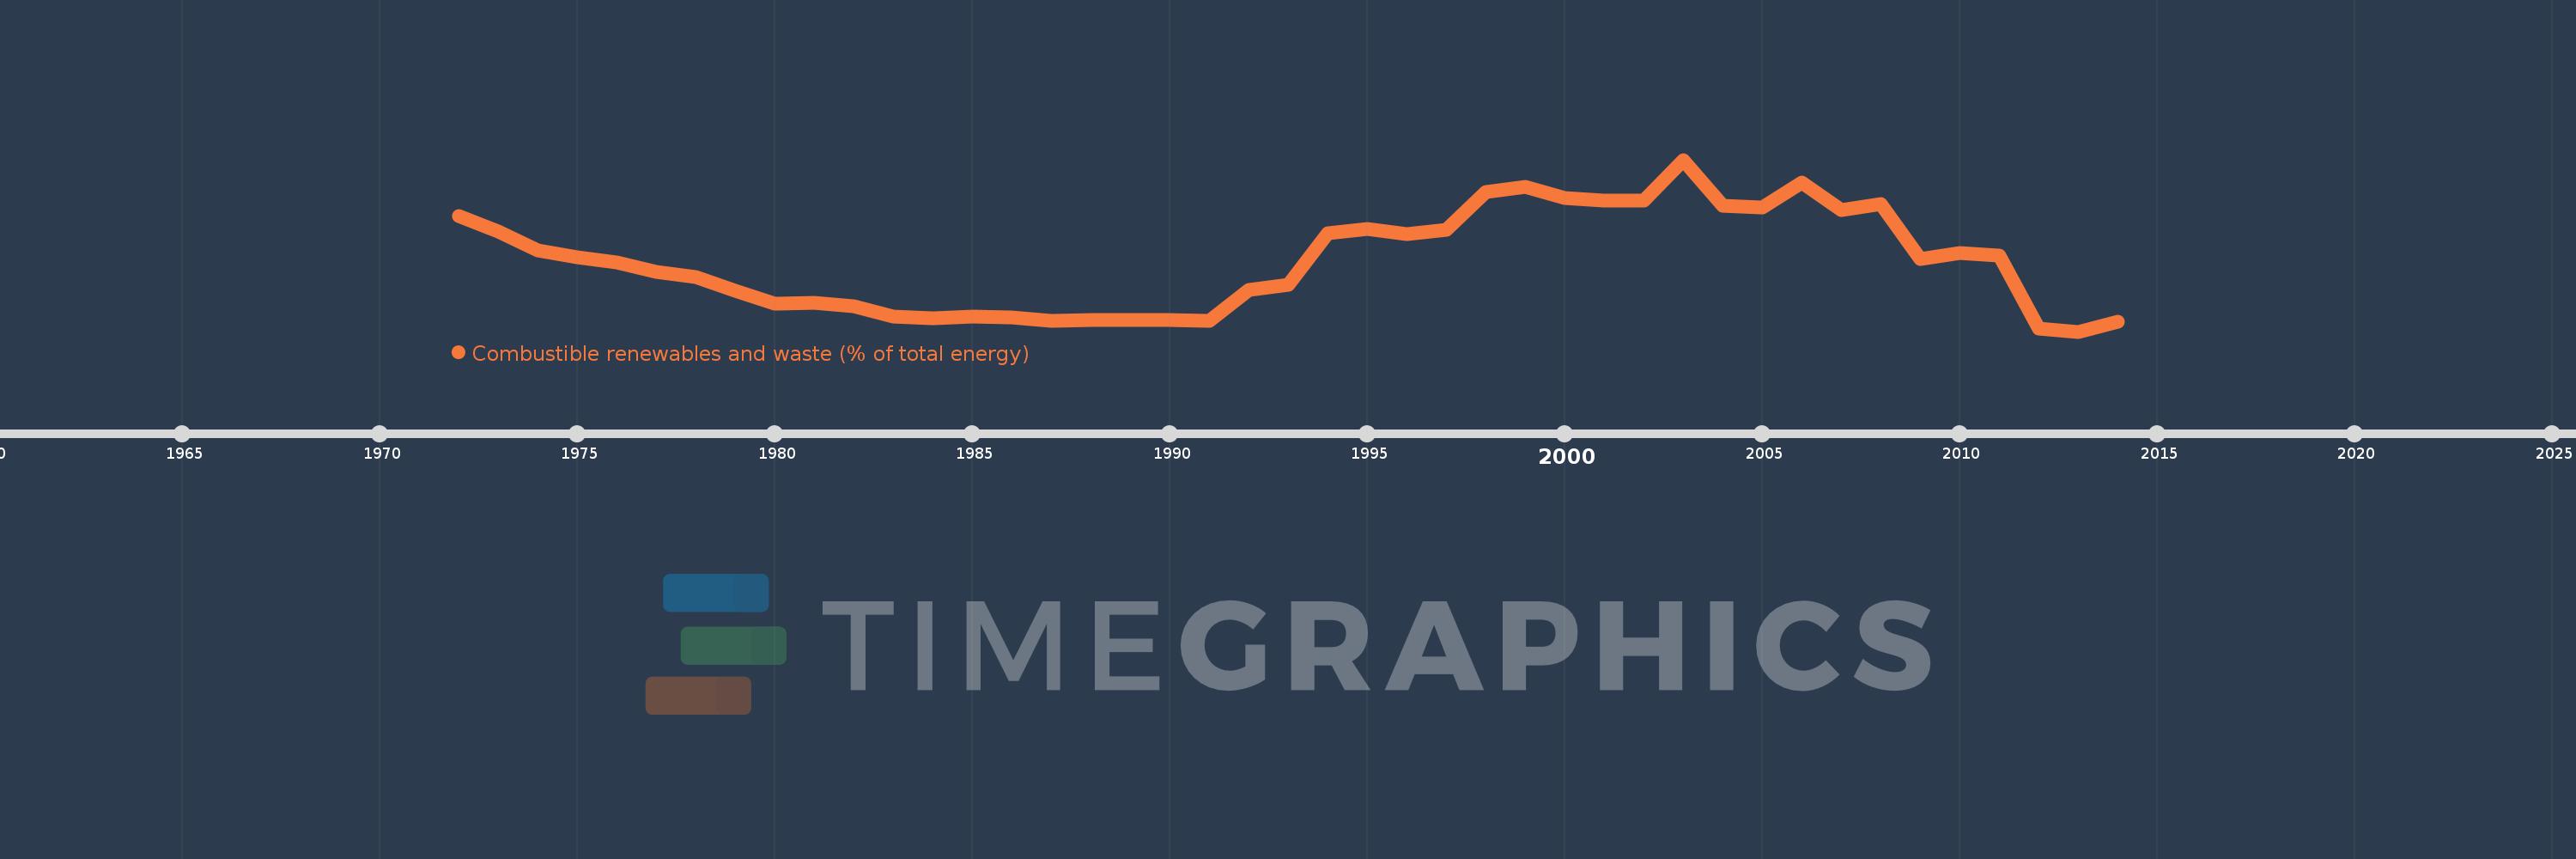
Combustible renewables and waste (% of total energy)
2014,2013,2012,2011,2010,2009,2008,2007,2006,2005,2004,2003,2002,2001,2000,1999,1998,1997,1996,1995,1994,1993,1992,1991,1990,1989,1988,1987,1986,1985,1984,1983,1982,1981,1980,1979,1978,1977,1976,1975,1974,1973,1972
This statistics in other country:
AlbaniaAlgeriaAngolaArab WorldArgentinaArmeniaAustraliaAustriaAzerbaijanBahrainBangladeshBelarusBelgiumBeninBoliviaBosnia and HerzegovinaBotswanaBrazilBrunei DarussalamBulgariaCambodiaCameroonCanadaCaribbean small statesCentral Europe and the BalticsChileChinaColombiaCongo, Dem. Rep.Congo, Rep.Costa RicaCote d'IvoireCroatiaCubaCuracaoCyprusCzech RepublicDenmarkDominican RepublicEarly-demographic dividendEast Asia & PacificEast Asia & Pacific (excluding high income)East Asia & Pacific (IDA & IBRD countries)EcuadorEgypt, Arab Rep.El SalvadorEritreaEstoniaEthiopiaEuro areaEurope & Central AsiaEurope & Central Asia (excluding high income)Europe & Central Asia (IDA & IBRD countries)European UnionFinlandFragile and conflict affected situationsFranceGabonGeorgiaGermanyGhanaGibraltarGreeceGuatemalaHaitiHeavily indebted poor countries (HIPC)High incomeHondurasHong Kong SAR, ChinaHungaryIBRD onlyIcelandIDA & IBRD totalIDA blendIDA onlyIDA totalIndiaIndonesiaIran, Islamic Rep.IraqIrelandIsraelItalyJamaicaJapanJordanKazakhstanKenyaKorea, Dem. People’s Rep.Korea, Rep.KosovoKuwaitKyrgyz RepublicLate-demographic dividendLatin America & Caribbean Latin America & Caribbean (excluding high income)Latin America & the Caribbean (IDA & IBRD countries)LatviaLeast developed countries: UN classificationLebanonLibyaLithuaniaLow & middle incomeLow incomeLower middle incomeLuxembourgMacedonia, FYRMalaysiaMaltaMauritiusMexicoMiddle East & North AfricaMiddle East & North Africa (excluding high income)Middle East & North Africa (IDA & IBRD countries)Middle incomeMoldovaMongoliaMontenegroMoroccoMozambiqueMyanmarNamibiaNepalNetherlandsNew ZealandNicaraguaNigerNigeriaNorth AmericaNorwayOECD membersOmanOther small statesPakistanPanamaParaguayPeruPhilippinesPolandPortugalPost-demographic dividendPre-demographic dividendQatarRomaniaRussian FederationSaudi ArabiaSenegalSerbiaSingaporeSlovak RepublicSloveniaSmall statesSouth AfricaSouth AsiaSouth Asia (IDA & IBRD)South SudanSpainSri LankaSub-Saharan Africa Sub-Saharan Africa (excluding high income)Sub-Saharan Africa (IDA & IBRD countries)SudanSwedenSwitzerlandSyrian Arab RepublicTajikistanTanzaniaThailandTogoTrinidad and TobagoTunisiaTurkeyTurkmenistanUkraineUnited Arab EmiratesUnited KingdomUnited StatesUpper middle incomeUruguayUzbekistanVenezuela, RBVietnamWorldYemen, Rep.ZambiaZimbabwe Timeline:
This timeline shows a graph from 1972 to 2014 of Algeria. No data until 1971. Number of actual observations by date: 43.
Source name:
World Development Indicators
Source organization:
IEA Statistics © OECD/IEA 2014 (http://www.iea.org/stats/index.asp), subject to https://www.iea.org/t&c/termsandconditions/
Categories, topics:
Energy & Mining
Last updated:
apr 23, 2017
Indicators value changes by year
At the date of observation
Value
Absolute change
Change from previous value
jan 1, 1972
0.179
+0.179
0.0%
jan 1, 1973
0.159
-0.019
-10.84%
jan 1, 1974
0.136
-0.024
-14.76%
jan 1, 1975
0.127
-0.009
-6.68%
jan 1, 1976
0.121
-0.006
-4.35%
jan 1, 1977
0.109
-0.012
-9.88%
jan 1, 1978
0.102
-0.008
-6.93%
jan 1, 1979
0.085
-0.016
-16.07%
jan 1, 1980
0.069
-0.016
-18.77%
jan 1, 1981
0.07
+0.001
1.25%
jan 1, 1982
0.066
-0.004
-5.23%
jan 1, 1983
0.053
-0.014
-20.51%
jan 1, 1984
0.051
-0.002
-4.31%
jan 1, 1985
0.053
+0.002
4.24%
jan 1, 1986
0.052
-0.001
-2.17%
jan 1, 1987
0.047
-0.004
-8.47%
jan 1, 1988
0.049
+0.002
4.08%
jan 1, 1989
0.048
-0.001
-2.71%
jan 1, 1990
0.049
+0.002
3.51%
jan 1, 1991
0.047
-0.002
-4.22%
jan 1, 1992
0.086
+0.039
82.63%
jan 1, 1993
0.093
+0.007
7.8%
jan 1, 1994
0.157
+0.064
68.17%
jan 1, 1995
0.163
+0.006
3.75%
jan 1, 1996
0.156
-0.007
-4.16%
jan 1, 1997
0.161
+0.005
3.28%
jan 1, 1998
0.209
+0.048
30.08%
jan 1, 1999
0.215
+0.006
2.67%
jan 1, 2000
0.201
-0.014
-6.32%
jan 1, 2001
0.198
-0.003
-1.55%
jan 1, 2002
0.198
0.0
-0.2%
jan 1, 2003
0.249
+0.051
25.89%
jan 1, 2004
0.191
-0.058
-23.26%
jan 1, 2005
0.189
-0.002
-1.23%
jan 1, 2006
0.22
+0.031
16.58%
jan 1, 2007
0.186
-0.035
-15.67%
jan 1, 2008
0.194
+0.008
4.36%
jan 1, 2009
0.125
-0.069
-35.55%
jan 1, 2010
0.132
+0.007
5.37%
jan 1, 2011
0.129
-0.002
-1.8%
jan 1, 2012
0.038
-0.091
-70.21%
jan 1, 2013
0.034
-0.005
-11.99%
jan 1, 2014
0.046
+0.012
36.02%
Ranking of countries by current statistics by years


Comments: