29
/
en
AIzaSyAYiBZKx7MnpbEhh9jyipgxe19OcubqV5w
April 1, 2024
176173
Lebanon
LBN
true
2
1
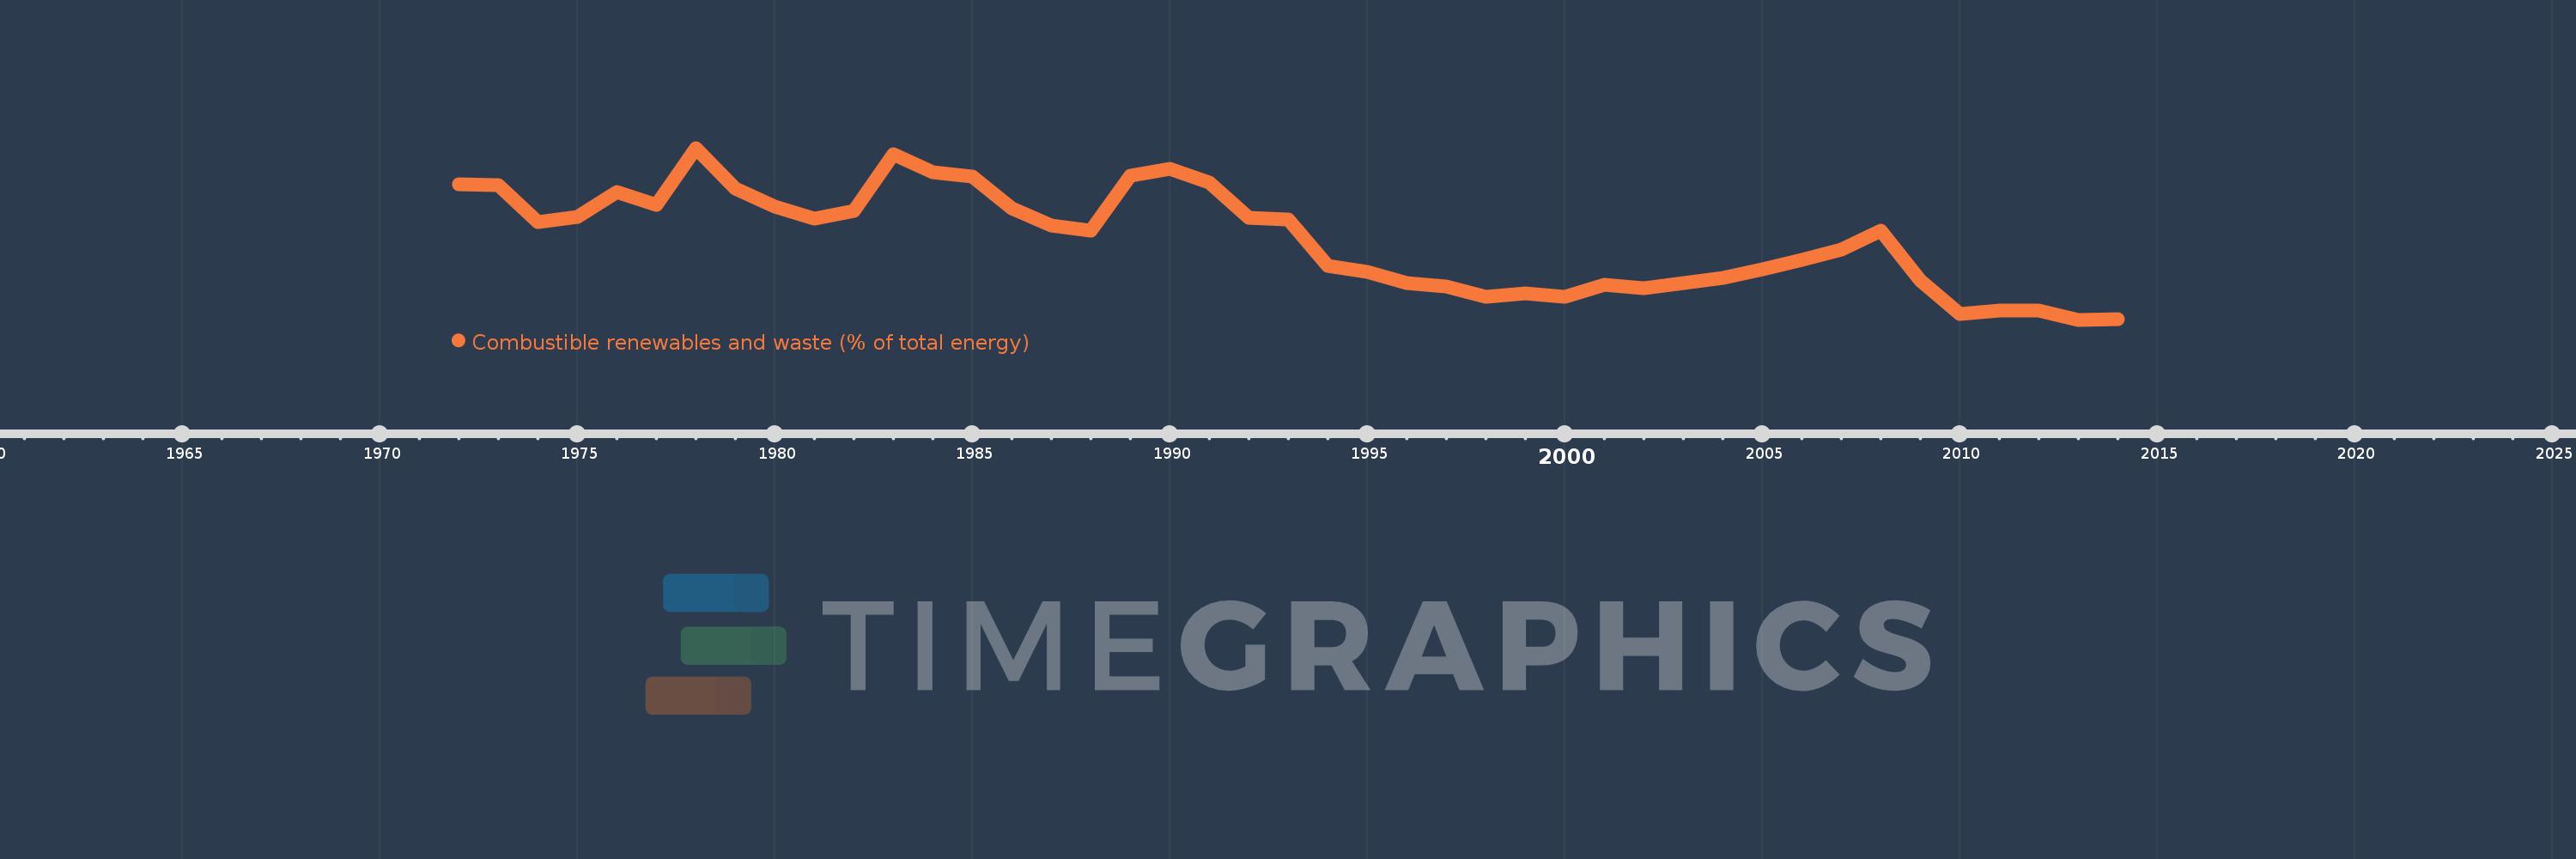
Combustible renewables and waste (% of total energy)
2014,2013,2012,2011,2010,2009,2008,2007,2006,2005,2004,2003,2002,2001,2000,1999,1998,1997,1996,1995,1994,1993,1992,1991,1990,1989,1988,1987,1986,1985,1984,1983,1982,1981,1980,1979,1978,1977,1976,1975,1974,1973,1972
This statistics in other country:
AlbaniaAlgeriaAngolaArab WorldArgentinaArmeniaAustraliaAustriaAzerbaijanBahrainBangladeshBelarusBelgiumBeninBoliviaBosnia and HerzegovinaBotswanaBrazilBrunei DarussalamBulgariaCambodiaCameroonCanadaCaribbean small statesCentral Europe and the BalticsChileChinaColombiaCongo, Dem. Rep.Congo, Rep.Costa RicaCote d'IvoireCroatiaCubaCuracaoCyprusCzech RepublicDenmarkDominican RepublicEarly-demographic dividendEast Asia & PacificEast Asia & Pacific (excluding high income)East Asia & Pacific (IDA & IBRD countries)EcuadorEgypt, Arab Rep.El SalvadorEritreaEstoniaEthiopiaEuro areaEurope & Central AsiaEurope & Central Asia (excluding high income)Europe & Central Asia (IDA & IBRD countries)European UnionFinlandFragile and conflict affected situationsFranceGabonGeorgiaGermanyGhanaGibraltarGreeceGuatemalaHaitiHeavily indebted poor countries (HIPC)High incomeHondurasHong Kong SAR, ChinaHungaryIBRD onlyIcelandIDA & IBRD totalIDA blendIDA onlyIDA totalIndiaIndonesiaIran, Islamic Rep.IraqIrelandIsraelItalyJamaicaJapanJordanKazakhstanKenyaKorea, Dem. People’s Rep.Korea, Rep.KosovoKuwaitKyrgyz RepublicLate-demographic dividendLatin America & Caribbean Latin America & Caribbean (excluding high income)Latin America & the Caribbean (IDA & IBRD countries)LatviaLeast developed countries: UN classificationLebanonLibyaLithuaniaLow & middle incomeLow incomeLower middle incomeLuxembourgMacedonia, FYRMalaysiaMaltaMauritiusMexicoMiddle East & North AfricaMiddle East & North Africa (excluding high income)Middle East & North Africa (IDA & IBRD countries)Middle incomeMoldovaMongoliaMontenegroMoroccoMozambiqueMyanmarNamibiaNepalNetherlandsNew ZealandNicaraguaNigerNigeriaNorth AmericaNorwayOECD membersOmanOther small statesPakistanPanamaParaguayPeruPhilippinesPolandPortugalPost-demographic dividendPre-demographic dividendQatarRomaniaRussian FederationSaudi ArabiaSenegalSerbiaSingaporeSlovak RepublicSloveniaSmall statesSouth AfricaSouth AsiaSouth Asia (IDA & IBRD)South SudanSpainSri LankaSub-Saharan Africa Sub-Saharan Africa (excluding high income)Sub-Saharan Africa (IDA & IBRD countries)SudanSwedenSwitzerlandSyrian Arab RepublicTajikistanTanzaniaThailandTogoTrinidad and TobagoTunisiaTurkeyTurkmenistanUkraineUnited Arab EmiratesUnited KingdomUnited StatesUpper middle incomeUruguayUzbekistanVenezuela, RBVietnamWorldYemen, Rep.ZambiaZimbabwe Timeline:
This timeline shows a graph from 1972 to 2014 of Lebanon. No data until 1971. Number of actual observations by date: 43.
Source name:
World Development Indicators
Source organization:
IEA Statistics © OECD/IEA 2014 (http://www.iea.org/stats/index.asp), subject to https://www.iea.org/t&c/termsandconditions/
Categories, topics:
Energy & Mining
Last updated:
apr 23, 2017
Indicators value changes by year
At the date of observation
Value
Absolute change
Change from previous value
jan 1, 1972
5.212
+5.212
0.0%
jan 1, 1973
5.207
-0.005
-0.09%
jan 1, 1974
4.256
-0.951
-18.27%
jan 1, 1975
4.379
+0.123
2.89%
jan 1, 1976
5.023
+0.643
14.69%
jan 1, 1977
4.695
-0.327
-6.52%
jan 1, 1978
6.15
+1.454
30.97%
jan 1, 1979
5.117
-1.032
-16.79%
jan 1, 1980
4.648
-0.469
-9.16%
jan 1, 1981
4.341
-0.307
-6.61%
jan 1, 1982
4.535
+0.194
4.48%
jan 1, 1983
5.986
+1.451
31.98%
jan 1, 1984
5.525
-0.461
-7.7%
jan 1, 1985
5.428
-0.097
-1.76%
jan 1, 1986
4.601
-0.827
-15.24%
jan 1, 1987
4.156
-0.445
-9.68%
jan 1, 1988
4.04
-0.116
-2.79%
jan 1, 1989
5.449
+1.409
34.88%
jan 1, 1990
5.607
+0.158
2.9%
jan 1, 1991
5.257
-0.35
-6.23%
jan 1, 1992
4.373
-0.884
-16.82%
jan 1, 1993
4.322
-0.051
-1.17%
jan 1, 1994
3.129
-1.193
-27.6%
jan 1, 1995
2.979
-0.15
-4.79%
jan 1, 1996
2.685
-0.294
-9.86%
jan 1, 1997
2.613
-0.072
-2.68%
jan 1, 1998
2.342
-0.271
-10.37%
jan 1, 1999
2.427
+0.084
3.6%
jan 1, 2000
2.351
-0.075
-3.11%
jan 1, 2001
2.65
+0.299
12.72%
jan 1, 2002
2.566
-0.084
-3.18%
jan 1, 2003
2.704
+0.138
5.38%
jan 1, 2004
2.835
+0.131
4.85%
jan 1, 2005
3.042
+0.207
7.29%
jan 1, 2006
3.296
+0.254
8.34%
jan 1, 2007
3.544
+0.248
7.53%
jan 1, 2008
4.042
+0.498
14.06%
jan 1, 2009
2.756
-1.286
-31.81%
jan 1, 2010
1.904
-0.853
-30.94%
jan 1, 2011
1.981
+0.077
4.05%
jan 1, 2012
1.988
+0.007
0.35%
jan 1, 2013
1.756
-0.232
-11.65%
jan 1, 2014
1.779
+0.023
1.28%
Ranking of countries by current statistics by years


Comments: