29
/
en
AIzaSyAYiBZKx7MnpbEhh9jyipgxe19OcubqV5w
April 1, 2024
252810
Sudan
SDN
true
2
1
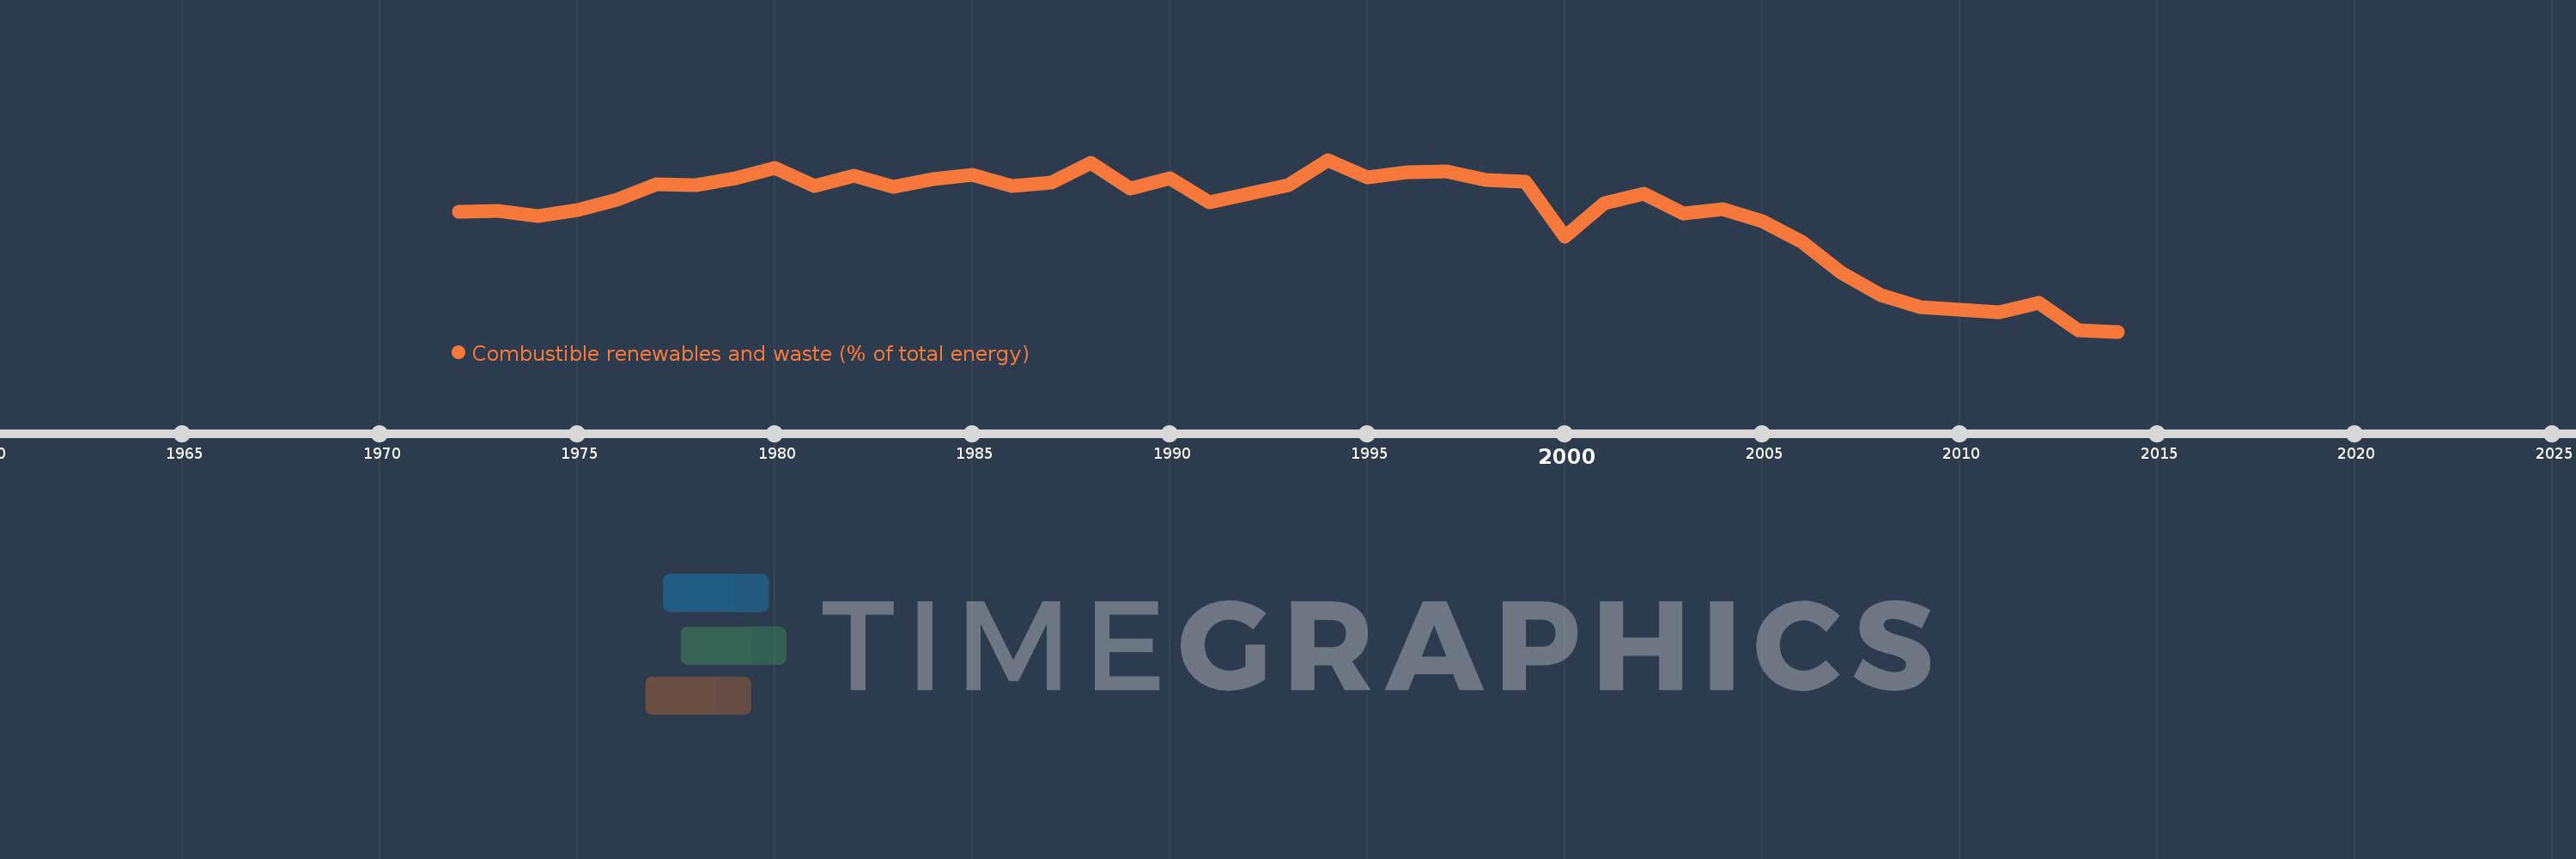
Combustible renewables and waste (% of total energy)
2014,2013,2012,2011,2010,2009,2008,2007,2006,2005,2004,2003,2002,2001,2000,1999,1998,1997,1996,1995,1994,1993,1992,1991,1990,1989,1988,1987,1986,1985,1984,1983,1982,1981,1980,1979,1978,1977,1976,1975,1974,1973,1972
This statistics in other country:
AlbaniaAlgeriaAngolaArab WorldArgentinaArmeniaAustraliaAustriaAzerbaijanBahrainBangladeshBelarusBelgiumBeninBoliviaBosnia and HerzegovinaBotswanaBrazilBrunei DarussalamBulgariaCambodiaCameroonCanadaCaribbean small statesCentral Europe and the BalticsChileChinaColombiaCongo, Dem. Rep.Congo, Rep.Costa RicaCote d'IvoireCroatiaCubaCuracaoCyprusCzech RepublicDenmarkDominican RepublicEarly-demographic dividendEast Asia & PacificEast Asia & Pacific (excluding high income)East Asia & Pacific (IDA & IBRD countries)EcuadorEgypt, Arab Rep.El SalvadorEritreaEstoniaEthiopiaEuro areaEurope & Central AsiaEurope & Central Asia (excluding high income)Europe & Central Asia (IDA & IBRD countries)European UnionFinlandFragile and conflict affected situationsFranceGabonGeorgiaGermanyGhanaGibraltarGreeceGuatemalaHaitiHeavily indebted poor countries (HIPC)High incomeHondurasHong Kong SAR, ChinaHungaryIBRD onlyIcelandIDA & IBRD totalIDA blendIDA onlyIDA totalIndiaIndonesiaIran, Islamic Rep.IraqIrelandIsraelItalyJamaicaJapanJordanKazakhstanKenyaKorea, Dem. People’s Rep.Korea, Rep.KosovoKuwaitKyrgyz RepublicLate-demographic dividendLatin America & Caribbean Latin America & Caribbean (excluding high income)Latin America & the Caribbean (IDA & IBRD countries)LatviaLeast developed countries: UN classificationLebanonLibyaLithuaniaLow & middle incomeLow incomeLower middle incomeLuxembourgMacedonia, FYRMalaysiaMaltaMauritiusMexicoMiddle East & North AfricaMiddle East & North Africa (excluding high income)Middle East & North Africa (IDA & IBRD countries)Middle incomeMoldovaMongoliaMontenegroMoroccoMozambiqueMyanmarNamibiaNepalNetherlandsNew ZealandNicaraguaNigerNigeriaNorth AmericaNorwayOECD membersOmanOther small statesPakistanPanamaParaguayPeruPhilippinesPolandPortugalPost-demographic dividendPre-demographic dividendQatarRomaniaRussian FederationSaudi ArabiaSenegalSerbiaSingaporeSlovak RepublicSloveniaSmall statesSouth AfricaSouth AsiaSouth Asia (IDA & IBRD)South SudanSpainSri LankaSub-Saharan Africa Sub-Saharan Africa (excluding high income)Sub-Saharan Africa (IDA & IBRD countries)SudanSwedenSwitzerlandSyrian Arab RepublicTajikistanTanzaniaThailandTogoTrinidad and TobagoTunisiaTurkeyTurkmenistanUkraineUnited Arab EmiratesUnited KingdomUnited StatesUpper middle incomeUruguayUzbekistanVenezuela, RBVietnamWorldYemen, Rep.ZambiaZimbabwe Timeline:
This timeline shows a graph from 1972 to 2014 of Sudan. No data until 1971. Number of actual observations by date: 43.
Source name:
World Development Indicators
Source organization:
IEA Statistics © OECD/IEA 2014 (http://www.iea.org/stats/index.asp), subject to https://www.iea.org/t&c/termsandconditions/
Categories, topics:
Energy & Mining
Last updated:
apr 23, 2017
Indicators value changes by year
Minimum:
62.943
jan 1, 2014
Maximum:
87.972
jan 1, 1994
At the date of observation
Value
Absolute change
Change from previous value
jan 1, 1972
80.345
+80.345
0.0%
jan 1, 1973
80.499
+0.154
0.19%
jan 1, 1974
79.756
-0.743
-0.92%
jan 1, 1975
80.649
+0.893
1.12%
jan 1, 1976
82.202
+1.553
1.93%
jan 1, 1977
84.397
+2.195
2.67%
jan 1, 1978
84.218
-0.178
-0.21%
jan 1, 1979
85.261
+1.042
1.24%
jan 1, 1980
86.78
+1.519
1.78%
jan 1, 1981
84.156
-2.624
-3.02%
jan 1, 1982
85.6
+1.445
1.72%
jan 1, 1983
84.08
-1.521
-1.78%
jan 1, 1984
85.164
+1.084
1.29%
jan 1, 1985
85.802
+0.639
0.75%
jan 1, 1986
84.167
-1.636
-1.91%
jan 1, 1987
84.605
+0.438
0.52%
jan 1, 1988
87.534
+2.929
3.46%
jan 1, 1989
83.813
-3.72
-4.25%
jan 1, 1990
85.229
+1.415
1.69%
jan 1, 1991
81.776
-3.452
-4.05%
jan 1, 1992
83.075
+1.298
1.59%
jan 1, 1993
84.279
+1.204
1.45%
jan 1, 1994
87.972
+3.694
4.38%
jan 1, 1995
85.44
-2.533
-2.88%
jan 1, 1996
86.118
+0.678
0.79%
jan 1, 1997
86.274
+0.156
0.18%
jan 1, 1998
85.069
-1.205
-1.4%
jan 1, 1999
84.749
-0.32
-0.38%
jan 1, 2000
76.833
-7.915
-9.34%
jan 1, 2001
81.661
+4.828
6.28%
jan 1, 2002
83.038
+1.377
1.69%
jan 1, 2003
80.147
-2.891
-3.48%
jan 1, 2004
80.757
+0.61
0.76%
jan 1, 2005
79.076
-1.682
-2.08%
jan 1, 2006
75.965
-3.111
-3.93%
jan 1, 2007
71.545
-4.419
-5.82%
jan 1, 2008
68.246
-3.299
-4.61%
jan 1, 2009
66.473
-1.773
-2.6%
jan 1, 2010
66.107
-0.366
-0.55%
jan 1, 2011
65.806
-0.301
-0.46%
jan 1, 2012
67.131
+1.324
2.01%
jan 1, 2013
63.096
-4.035
-6.01%
jan 1, 2014
62.943
-0.153
-0.24%
Ranking of countries by current statistics by years


Comments: