29
/
en
AIzaSyAYiBZKx7MnpbEhh9jyipgxe19OcubqV5w
April 1, 2024
269084
Turkey
TUR
true
2
1
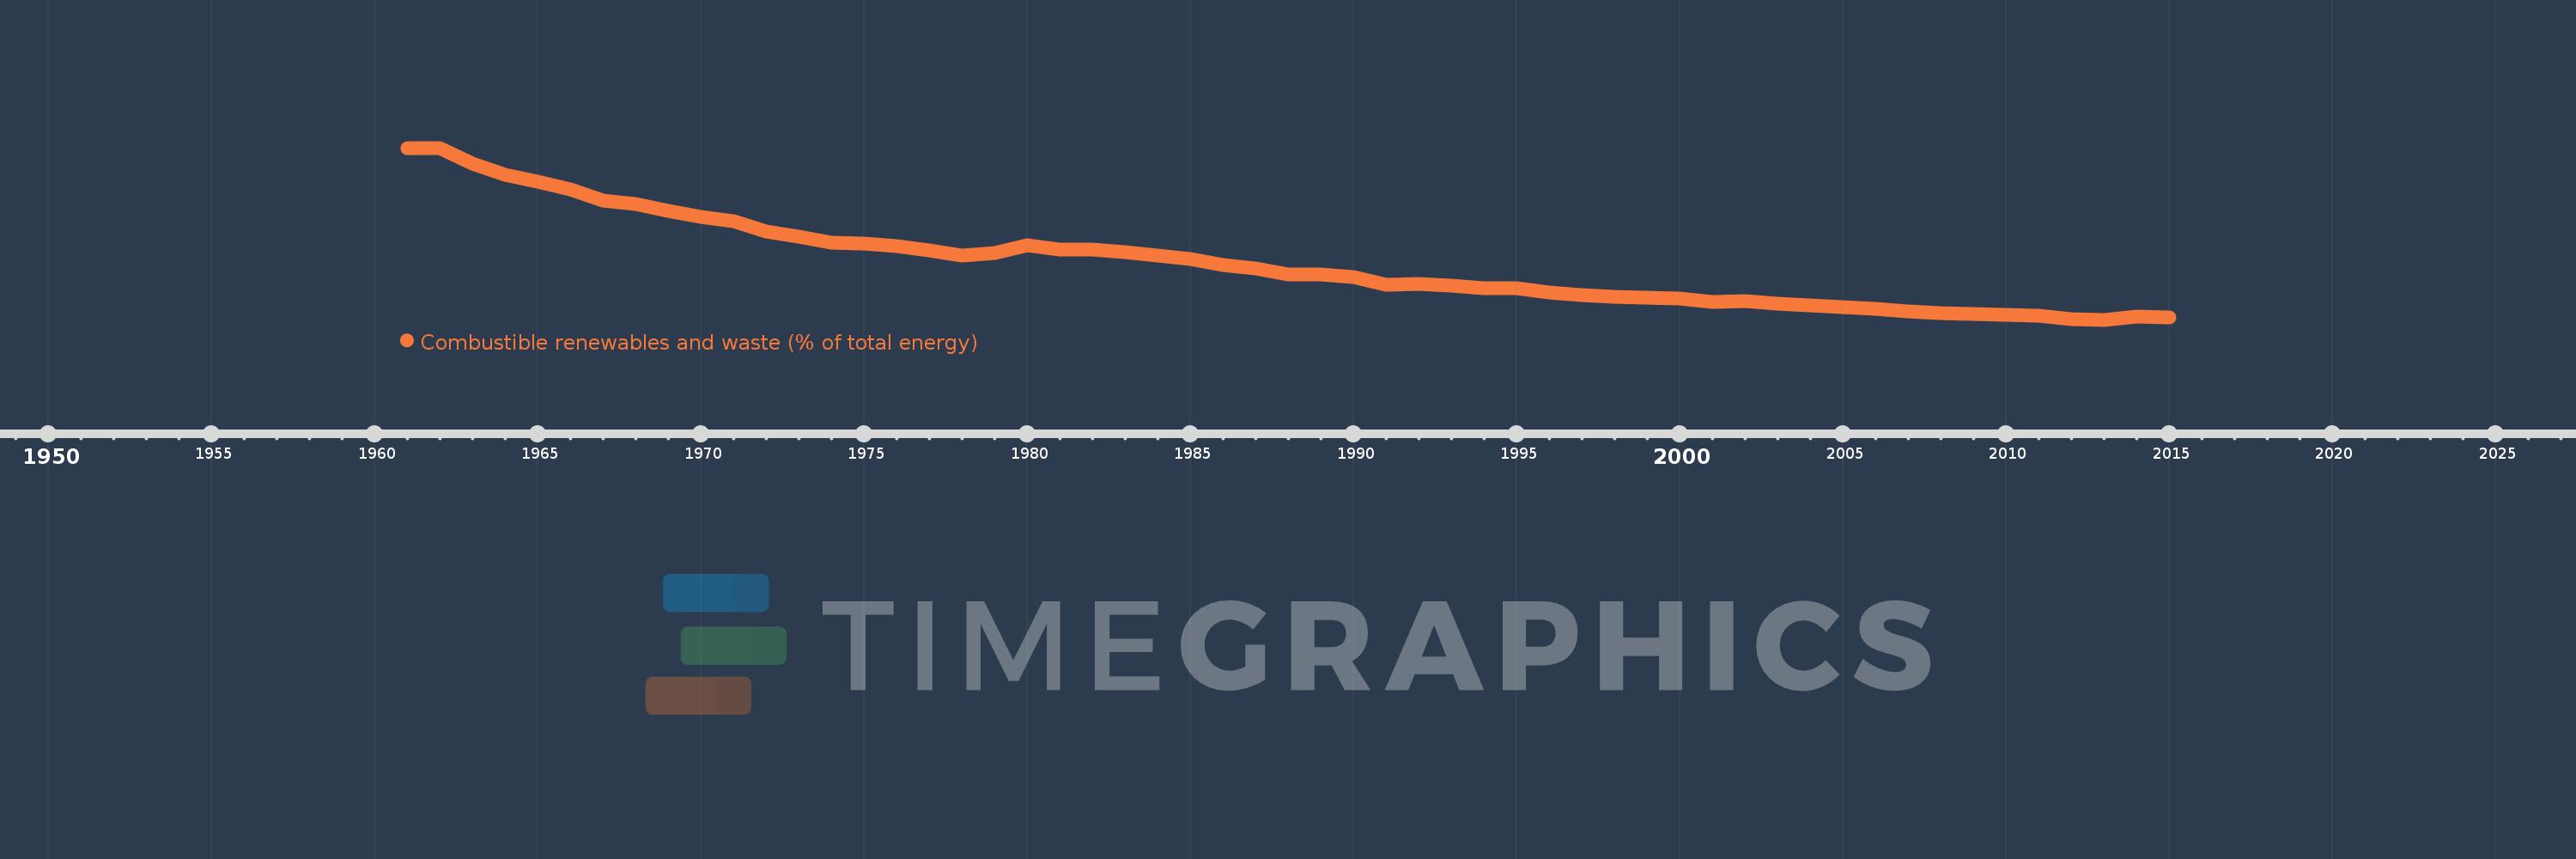
Combustible renewables and waste (% of total energy)
2015,2014,2013,2012,2011,2010,2009,2008,2007,2006,2005,2004,2003,2002,2001,2000,1999,1998,1997,1996,1995,1994,1993,1992,1991,1990,1989,1988,1987,1986,1985,1984,1983,1982,1981,1980,1979,1978,1977,1976,1975,1974,1973,1972,1971,1970,1969,1968,1967,1966,1965,1964,1963,1962,1961
This statistics in other country:
AlbaniaAlgeriaAngolaArab WorldArgentinaArmeniaAustraliaAustriaAzerbaijanBahrainBangladeshBelarusBelgiumBeninBoliviaBosnia and HerzegovinaBotswanaBrazilBrunei DarussalamBulgariaCambodiaCameroonCanadaCaribbean small statesCentral Europe and the BalticsChileChinaColombiaCongo, Dem. Rep.Congo, Rep.Costa RicaCote d'IvoireCroatiaCubaCuracaoCyprusCzech RepublicDenmarkDominican RepublicEarly-demographic dividendEast Asia & PacificEast Asia & Pacific (excluding high income)East Asia & Pacific (IDA & IBRD countries)EcuadorEgypt, Arab Rep.El SalvadorEritreaEstoniaEthiopiaEuro areaEurope & Central AsiaEurope & Central Asia (excluding high income)Europe & Central Asia (IDA & IBRD countries)European UnionFinlandFragile and conflict affected situationsFranceGabonGeorgiaGermanyGhanaGibraltarGreeceGuatemalaHaitiHeavily indebted poor countries (HIPC)High incomeHondurasHong Kong SAR, ChinaHungaryIBRD onlyIcelandIDA & IBRD totalIDA blendIDA onlyIDA totalIndiaIndonesiaIran, Islamic Rep.IraqIrelandIsraelItalyJamaicaJapanJordanKazakhstanKenyaKorea, Dem. People’s Rep.Korea, Rep.KosovoKuwaitKyrgyz RepublicLate-demographic dividendLatin America & Caribbean Latin America & Caribbean (excluding high income)Latin America & the Caribbean (IDA & IBRD countries)LatviaLeast developed countries: UN classificationLebanonLibyaLithuaniaLow & middle incomeLow incomeLower middle incomeLuxembourgMacedonia, FYRMalaysiaMaltaMauritiusMexicoMiddle East & North AfricaMiddle East & North Africa (excluding high income)Middle East & North Africa (IDA & IBRD countries)Middle incomeMoldovaMongoliaMontenegroMoroccoMozambiqueMyanmarNamibiaNepalNetherlandsNew ZealandNicaraguaNigerNigeriaNorth AmericaNorwayOECD membersOmanOther small statesPakistanPanamaParaguayPeruPhilippinesPolandPortugalPost-demographic dividendPre-demographic dividendQatarRomaniaRussian FederationSaudi ArabiaSenegalSerbiaSingaporeSlovak RepublicSloveniaSmall statesSouth AfricaSouth AsiaSouth Asia (IDA & IBRD)South SudanSpainSri LankaSub-Saharan Africa Sub-Saharan Africa (excluding high income)Sub-Saharan Africa (IDA & IBRD countries)SudanSwedenSwitzerlandSyrian Arab RepublicTajikistanTanzaniaThailandTogoTrinidad and TobagoTunisiaTurkeyTurkmenistanUkraineUnited Arab EmiratesUnited KingdomUnited StatesUpper middle incomeUruguayUzbekistanVenezuela, RBVietnamWorldYemen, Rep.ZambiaZimbabwe Timeline:
This timeline shows a graph from 1961 to 2015 of Turkey. No data until 1960. Number of actual observations by date: 55.
Source name:
World Development Indicators
Source organization:
IEA Statistics © OECD/IEA 2014 (http://www.iea.org/stats/index.asp), subject to https://www.iea.org/t&c/termsandconditions/
Categories, topics:
Energy & Mining
Last updated:
apr 23, 2017
Indicators value changes by year
Maximum:
54.995
jan 1, 1961
At the date of observation
Value
Absolute change
Change from previous value
jan 1, 1961
54.995
+54.995
0.0%
jan 1, 1962
54.838
-0.157
-0.28%
jan 1, 1963
50.135
-4.703
-8.58%
jan 1, 1964
46.893
-3.242
-6.47%
jan 1, 1965
44.919
-1.974
-4.21%
jan 1, 1966
42.509
-2.41
-5.37%
jan 1, 1967
39.178
-3.331
-7.84%
jan 1, 1968
38.026
-1.152
-2.94%
jan 1, 1969
36.113
-1.913
-5.03%
jan 1, 1970
34.089
-2.024
-5.6%
jan 1, 1971
32.79
-1.299
-3.81%
jan 1, 1972
29.666
-3.124
-9.53%
jan 1, 1973
28.298
-1.368
-4.61%
jan 1, 1974
26.491
-1.808
-6.39%
jan 1, 1975
26.084
-0.407
-1.54%
jan 1, 1976
25.487
-0.597
-2.29%
jan 1, 1977
24.125
-1.362
-5.34%
jan 1, 1978
22.526
-1.6
-6.63%
jan 1, 1979
23.421
+0.895
3.97%
jan 1, 1980
25.59
+2.169
9.26%
jan 1, 1981
24.42
-1.169
-4.57%
jan 1, 1982
24.354
-0.066
-0.27%
jan 1, 1983
23.516
-0.839
-3.44%
jan 1, 1984
22.575
-0.94
-4.0%
jan 1, 1985
21.364
-1.211
-5.37%
jan 1, 1986
19.7
-1.664
-7.79%
jan 1, 1987
18.631
-1.069
-5.43%
jan 1, 1988
16.802
-1.829
-9.82%
jan 1, 1989
16.758
-0.044
-0.26%
jan 1, 1990
16.132
-0.626
-3.73%
jan 1, 1991
13.667
-2.465
-15.28%
jan 1, 1992
13.871
+0.203
1.49%
jan 1, 1993
13.437
-0.434
-3.13%
jan 1, 1994
12.56
-0.877
-6.53%
jan 1, 1995
12.698
+0.137
1.09%
jan 1, 1996
11.475
-1.222
-9.63%
jan 1, 1997
10.524
-0.952
-8.29%
jan 1, 1998
9.973
-0.551
-5.23%
jan 1, 1999
9.729
-0.244
-2.44%
jan 1, 2000
9.641
-0.088
-0.91%
jan 1, 2001
8.574
-1.067
-11.06%
jan 1, 2002
8.924
+0.35
4.08%
jan 1, 2003
8.105
-0.819
-9.18%
jan 1, 2004
7.418
-0.687
-8.47%
jan 1, 2005
6.883
-0.535
-7.21%
jan 1, 2006
6.36
-0.523
-7.6%
jan 1, 2007
5.571
-0.79
-12.41%
jan 1, 2008
5.056
-0.515
-9.24%
jan 1, 2009
4.892
-0.164
-3.25%
jan 1, 2010
4.772
-0.12
-2.45%
jan 1, 2011
4.331
-0.442
-9.25%
jan 1, 2012
3.263
-1.067
-24.65%
jan 1, 2013
3.172
-0.091
-2.8%
jan 1, 2014
4.204
+1.032
32.54%
jan 1, 2015
3.93
-0.274
-6.51%
Ranking of countries by current statistics by years


Comments: