29
/
en
AIzaSyAYiBZKx7MnpbEhh9jyipgxe19OcubqV5w
April 1, 2024
266655
Trinidad and Tobago
TTO
true
2
1
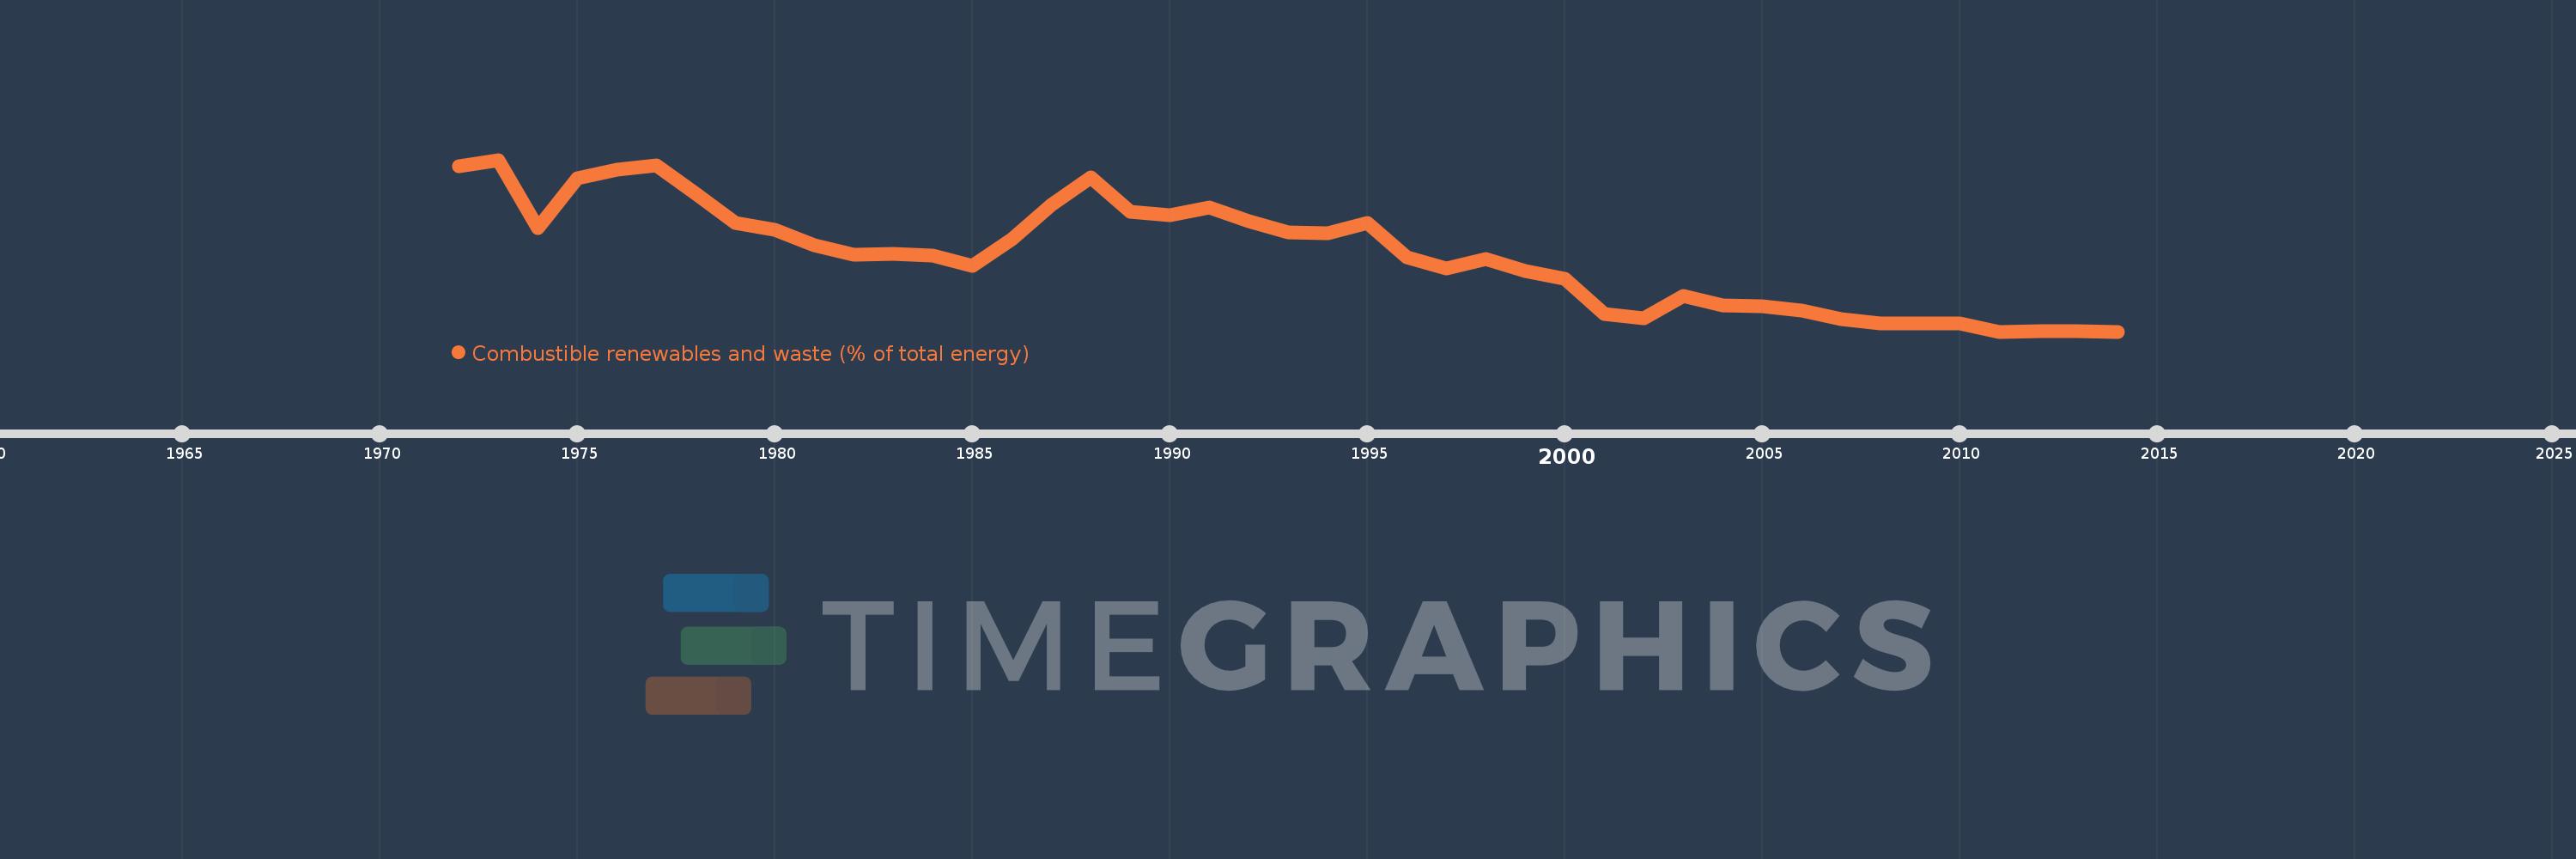
Combustible renewables and waste (% of total energy)
2014,2013,2012,2011,2010,2009,2008,2007,2006,2005,2004,2003,2002,2001,2000,1999,1998,1997,1996,1995,1994,1993,1992,1991,1990,1989,1988,1987,1986,1985,1984,1983,1982,1981,1980,1979,1978,1977,1976,1975,1974,1973,1972
This statistics in other country:
AlbaniaAlgeriaAngolaArab WorldArgentinaArmeniaAustraliaAustriaAzerbaijanBahrainBangladeshBelarusBelgiumBeninBoliviaBosnia and HerzegovinaBotswanaBrazilBrunei DarussalamBulgariaCambodiaCameroonCanadaCaribbean small statesCentral Europe and the BalticsChileChinaColombiaCongo, Dem. Rep.Congo, Rep.Costa RicaCote d'IvoireCroatiaCubaCuracaoCyprusCzech RepublicDenmarkDominican RepublicEarly-demographic dividendEast Asia & PacificEast Asia & Pacific (excluding high income)East Asia & Pacific (IDA & IBRD countries)EcuadorEgypt, Arab Rep.El SalvadorEritreaEstoniaEthiopiaEuro areaEurope & Central AsiaEurope & Central Asia (excluding high income)Europe & Central Asia (IDA & IBRD countries)European UnionFinlandFragile and conflict affected situationsFranceGabonGeorgiaGermanyGhanaGibraltarGreeceGuatemalaHaitiHeavily indebted poor countries (HIPC)High incomeHondurasHong Kong SAR, ChinaHungaryIBRD onlyIcelandIDA & IBRD totalIDA blendIDA onlyIDA totalIndiaIndonesiaIran, Islamic Rep.IraqIrelandIsraelItalyJamaicaJapanJordanKazakhstanKenyaKorea, Dem. People’s Rep.Korea, Rep.KosovoKuwaitKyrgyz RepublicLate-demographic dividendLatin America & Caribbean Latin America & Caribbean (excluding high income)Latin America & the Caribbean (IDA & IBRD countries)LatviaLeast developed countries: UN classificationLebanonLibyaLithuaniaLow & middle incomeLow incomeLower middle incomeLuxembourgMacedonia, FYRMalaysiaMaltaMauritiusMexicoMiddle East & North AfricaMiddle East & North Africa (excluding high income)Middle East & North Africa (IDA & IBRD countries)Middle incomeMoldovaMongoliaMontenegroMoroccoMozambiqueMyanmarNamibiaNepalNetherlandsNew ZealandNicaraguaNigerNigeriaNorth AmericaNorwayOECD membersOmanOther small statesPakistanPanamaParaguayPeruPhilippinesPolandPortugalPost-demographic dividendPre-demographic dividendQatarRomaniaRussian FederationSaudi ArabiaSenegalSerbiaSingaporeSlovak RepublicSloveniaSmall statesSouth AfricaSouth AsiaSouth Asia (IDA & IBRD)South SudanSpainSri LankaSub-Saharan Africa Sub-Saharan Africa (excluding high income)Sub-Saharan Africa (IDA & IBRD countries)SudanSwedenSwitzerlandSyrian Arab RepublicTajikistanTanzaniaThailandTogoTrinidad and TobagoTunisiaTurkeyTurkmenistanUkraineUnited Arab EmiratesUnited KingdomUnited StatesUpper middle incomeUruguayUzbekistanVenezuela, RBVietnamWorldYemen, Rep.ZambiaZimbabwe Timeline:
This timeline shows a graph from 1972 to 2014 of Trinidad and Tobago. No data until 1971. Number of actual observations by date: 43.
Source name:
World Development Indicators
Source organization:
IEA Statistics © OECD/IEA 2014 (http://www.iea.org/stats/index.asp), subject to https://www.iea.org/t&c/termsandconditions/
Categories, topics:
Energy & Mining
Last updated:
apr 23, 2017
Indicators value changes by year
At the date of observation
Value
Absolute change
Change from previous value
jan 1, 1972
1.442
+1.442
0.0%
jan 1, 1973
1.493
+0.051
3.55%
jan 1, 1974
0.927
-0.567
-37.95%
jan 1, 1975
1.34
+0.413
44.62%
jan 1, 1976
1.41
+0.07
5.24%
jan 1, 1977
1.45
+0.039
2.8%
jan 1, 1978
1.213
-0.237
-16.35%
jan 1, 1979
0.971
-0.242
-19.96%
jan 1, 1980
0.91
-0.06
-6.23%
jan 1, 1981
0.785
-0.125
-13.71%
jan 1, 1982
0.71
-0.075
-9.56%
jan 1, 1983
0.713
+0.003
0.4%
jan 1, 1984
0.697
-0.016
-2.25%
jan 1, 1985
0.615
-0.082
-11.78%
jan 1, 1986
0.832
+0.217
35.3%
jan 1, 1987
1.117
+0.285
34.23%
jan 1, 1988
1.348
+0.231
20.72%
jan 1, 1989
1.062
-0.287
-21.26%
jan 1, 1990
1.033
-0.029
-2.75%
jan 1, 1991
1.096
+0.064
6.19%
jan 1, 1992
0.982
-0.114
-10.4%
jan 1, 1993
0.895
-0.087
-8.85%
jan 1, 1994
0.888
-0.007
-0.79%
jan 1, 1995
0.973
+0.085
9.58%
jan 1, 1996
0.687
-0.286
-29.39%
jan 1, 1997
0.596
-0.091
-13.25%
jan 1, 1998
0.669
+0.073
12.21%
jan 1, 1999
0.572
-0.097
-14.46%
jan 1, 2000
0.511
-0.062
-10.81%
jan 1, 2001
0.218
-0.292
-57.21%
jan 1, 2002
0.181
-0.038
-17.32%
jan 1, 2003
0.366
+0.186
102.94%
jan 1, 2004
0.288
-0.079
-21.55%
jan 1, 2005
0.278
-0.01
-3.32%
jan 1, 2006
0.246
-0.032
-11.57%
jan 1, 2007
0.172
-0.073
-29.88%
jan 1, 2008
0.136
-0.036
-21.05%
jan 1, 2009
0.139
+0.003
2.34%
jan 1, 2010
0.138
-0.001
-1.07%
jan 1, 2011
0.07
-0.067
-48.95%
jan 1, 2012
0.071
+0.0
0.61%
jan 1, 2013
0.072
+0.001
1.69%
jan 1, 2014
0.07
-0.002
-2.64%
Ranking of countries by current statistics by years


Comments: