29
/
en
AIzaSyAYiBZKx7MnpbEhh9jyipgxe19OcubqV5w
April 1, 2024
228240
Romania
ROU
true
2
1
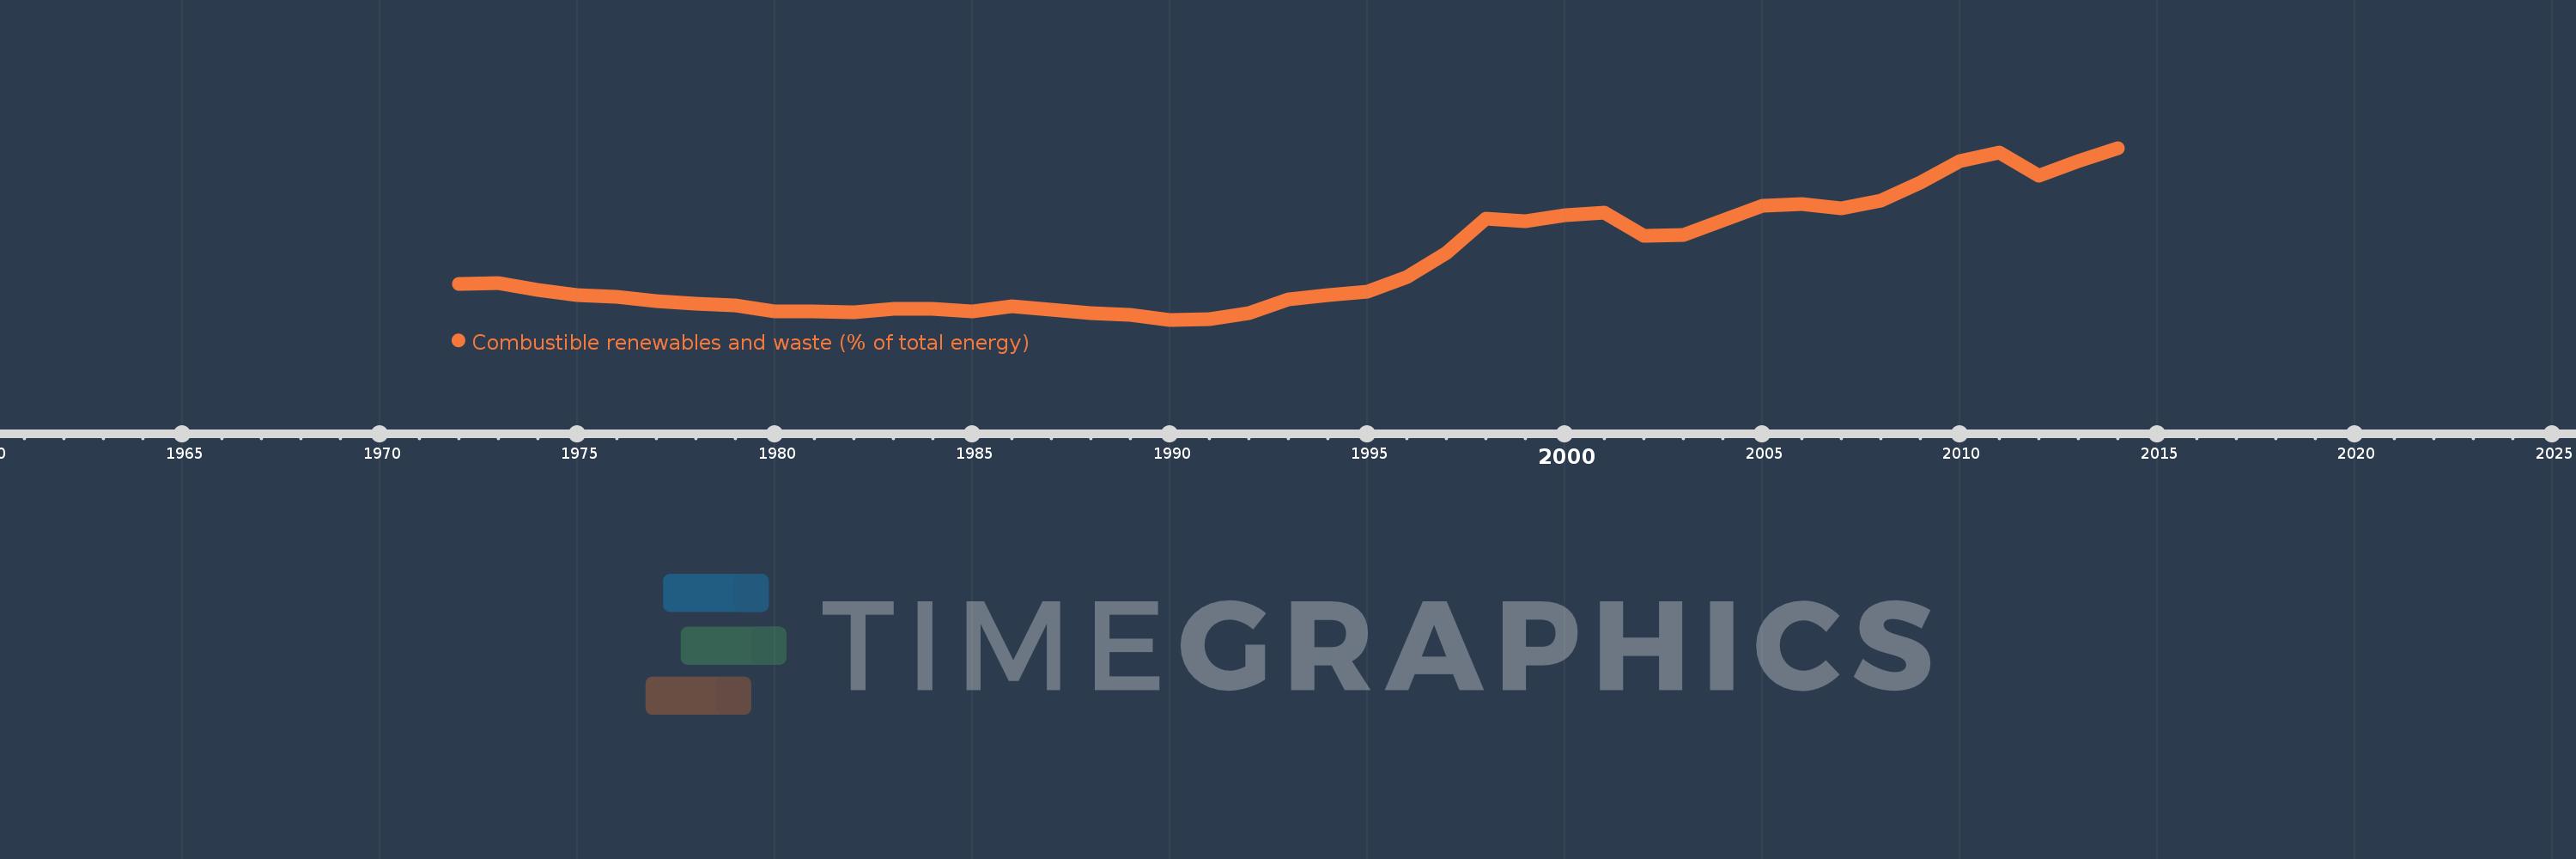
Combustible renewables and waste (% of total energy)
2014,2013,2012,2011,2010,2009,2008,2007,2006,2005,2004,2003,2002,2001,2000,1999,1998,1997,1996,1995,1994,1993,1992,1991,1990,1989,1988,1987,1986,1985,1984,1983,1982,1981,1980,1979,1978,1977,1976,1975,1974,1973,1972
This statistics in other country:
AlbaniaAlgeriaAngolaArab WorldArgentinaArmeniaAustraliaAustriaAzerbaijanBahrainBangladeshBelarusBelgiumBeninBoliviaBosnia and HerzegovinaBotswanaBrazilBrunei DarussalamBulgariaCambodiaCameroonCanadaCaribbean small statesCentral Europe and the BalticsChileChinaColombiaCongo, Dem. Rep.Congo, Rep.Costa RicaCote d'IvoireCroatiaCubaCuracaoCyprusCzech RepublicDenmarkDominican RepublicEarly-demographic dividendEast Asia & PacificEast Asia & Pacific (excluding high income)East Asia & Pacific (IDA & IBRD countries)EcuadorEgypt, Arab Rep.El SalvadorEritreaEstoniaEthiopiaEuro areaEurope & Central AsiaEurope & Central Asia (excluding high income)Europe & Central Asia (IDA & IBRD countries)European UnionFinlandFragile and conflict affected situationsFranceGabonGeorgiaGermanyGhanaGibraltarGreeceGuatemalaHaitiHeavily indebted poor countries (HIPC)High incomeHondurasHong Kong SAR, ChinaHungaryIBRD onlyIcelandIDA & IBRD totalIDA blendIDA onlyIDA totalIndiaIndonesiaIran, Islamic Rep.IraqIrelandIsraelItalyJamaicaJapanJordanKazakhstanKenyaKorea, Dem. People’s Rep.Korea, Rep.KosovoKuwaitKyrgyz RepublicLate-demographic dividendLatin America & Caribbean Latin America & Caribbean (excluding high income)Latin America & the Caribbean (IDA & IBRD countries)LatviaLeast developed countries: UN classificationLebanonLibyaLithuaniaLow & middle incomeLow incomeLower middle incomeLuxembourgMacedonia, FYRMalaysiaMaltaMauritiusMexicoMiddle East & North AfricaMiddle East & North Africa (excluding high income)Middle East & North Africa (IDA & IBRD countries)Middle incomeMoldovaMongoliaMontenegroMoroccoMozambiqueMyanmarNamibiaNepalNetherlandsNew ZealandNicaraguaNigerNigeriaNorth AmericaNorwayOECD membersOmanOther small statesPakistanPanamaParaguayPeruPhilippinesPolandPortugalPost-demographic dividendPre-demographic dividendQatarRomaniaRussian FederationSaudi ArabiaSenegalSerbiaSingaporeSlovak RepublicSloveniaSmall statesSouth AfricaSouth AsiaSouth Asia (IDA & IBRD)South SudanSpainSri LankaSub-Saharan Africa Sub-Saharan Africa (excluding high income)Sub-Saharan Africa (IDA & IBRD countries)SudanSwedenSwitzerlandSyrian Arab RepublicTajikistanTanzaniaThailandTogoTrinidad and TobagoTunisiaTurkeyTurkmenistanUkraineUnited Arab EmiratesUnited KingdomUnited StatesUpper middle incomeUruguayUzbekistanVenezuela, RBVietnamWorldYemen, Rep.ZambiaZimbabwe Timeline:
This timeline shows a graph from 1972 to 2014 of Romania. No data until 1971. Number of actual observations by date: 43.
Source name:
World Development Indicators
Source organization:
IEA Statistics © OECD/IEA 2014 (http://www.iea.org/stats/index.asp), subject to https://www.iea.org/t&c/termsandconditions/
Categories, topics:
Energy & Mining
Last updated:
apr 23, 2017
Indicators value changes by year
Maximum:
12.114
jan 1, 2014
At the date of observation
Value
Absolute change
Change from previous value
jan 1, 1972
3.291
+3.291
0.0%
jan 1, 1973
3.336
+0.045
1.37%
jan 1, 1974
2.861
-0.475
-14.23%
jan 1, 1975
2.561
-0.3
-10.48%
jan 1, 1976
2.429
-0.132
-5.16%
jan 1, 1977
2.143
-0.287
-11.8%
jan 1, 1978
1.971
-0.172
-8.02%
jan 1, 1979
1.871
-0.1
-5.05%
jan 1, 1980
1.508
-0.363
-19.39%
jan 1, 1981
1.465
-0.043
-2.88%
jan 1, 1982
1.429
-0.035
-2.42%
jan 1, 1983
1.643
+0.214
14.96%
jan 1, 1984
1.63
-0.013
-0.79%
jan 1, 1985
1.496
-0.135
-8.26%
jan 1, 1986
1.837
+0.341
22.83%
jan 1, 1987
1.62
-0.217
-11.8%
jan 1, 1988
1.371
-0.249
-15.38%
jan 1, 1989
1.281
-0.091
-6.61%
jan 1, 1990
0.941
-0.34
-26.54%
jan 1, 1991
0.966
+0.026
2.73%
jan 1, 1992
1.392
+0.426
44.08%
jan 1, 1993
2.258
+0.865
62.15%
jan 1, 1994
2.534
+0.277
12.26%
jan 1, 1995
2.753
+0.219
8.64%
jan 1, 1996
3.703
+0.95
34.5%
jan 1, 1997
5.302
+1.599
43.18%
jan 1, 1998
7.536
+2.234
42.12%
jan 1, 1999
7.36
-0.175
-2.33%
jan 1, 2000
7.766
+0.405
5.5%
jan 1, 2001
7.891
+0.125
1.61%
jan 1, 2002
6.406
-1.484
-18.81%
jan 1, 2003
6.459
+0.053
0.82%
jan 1, 2004
7.416
+0.957
14.82%
jan 1, 2005
8.333
+0.917
12.36%
jan 1, 2006
8.472
+0.139
1.67%
jan 1, 2007
8.175
-0.297
-3.51%
jan 1, 2008
8.704
+0.529
6.47%
jan 1, 2009
9.876
+1.172
13.47%
jan 1, 2010
11.264
+1.388
14.06%
jan 1, 2011
11.794
+0.529
4.7%
jan 1, 2012
10.295
-1.499
-12.71%
jan 1, 2013
11.267
+0.972
9.44%
jan 1, 2014
12.114
+0.846
7.51%
Ranking of countries by current statistics by years


Comments: