29
/
en
AIzaSyAYiBZKx7MnpbEhh9jyipgxe19OcubqV5w
April 1, 2024
43266
Latin America & the Caribbean (IDA & IBRD countries)
TLA
false
2
1
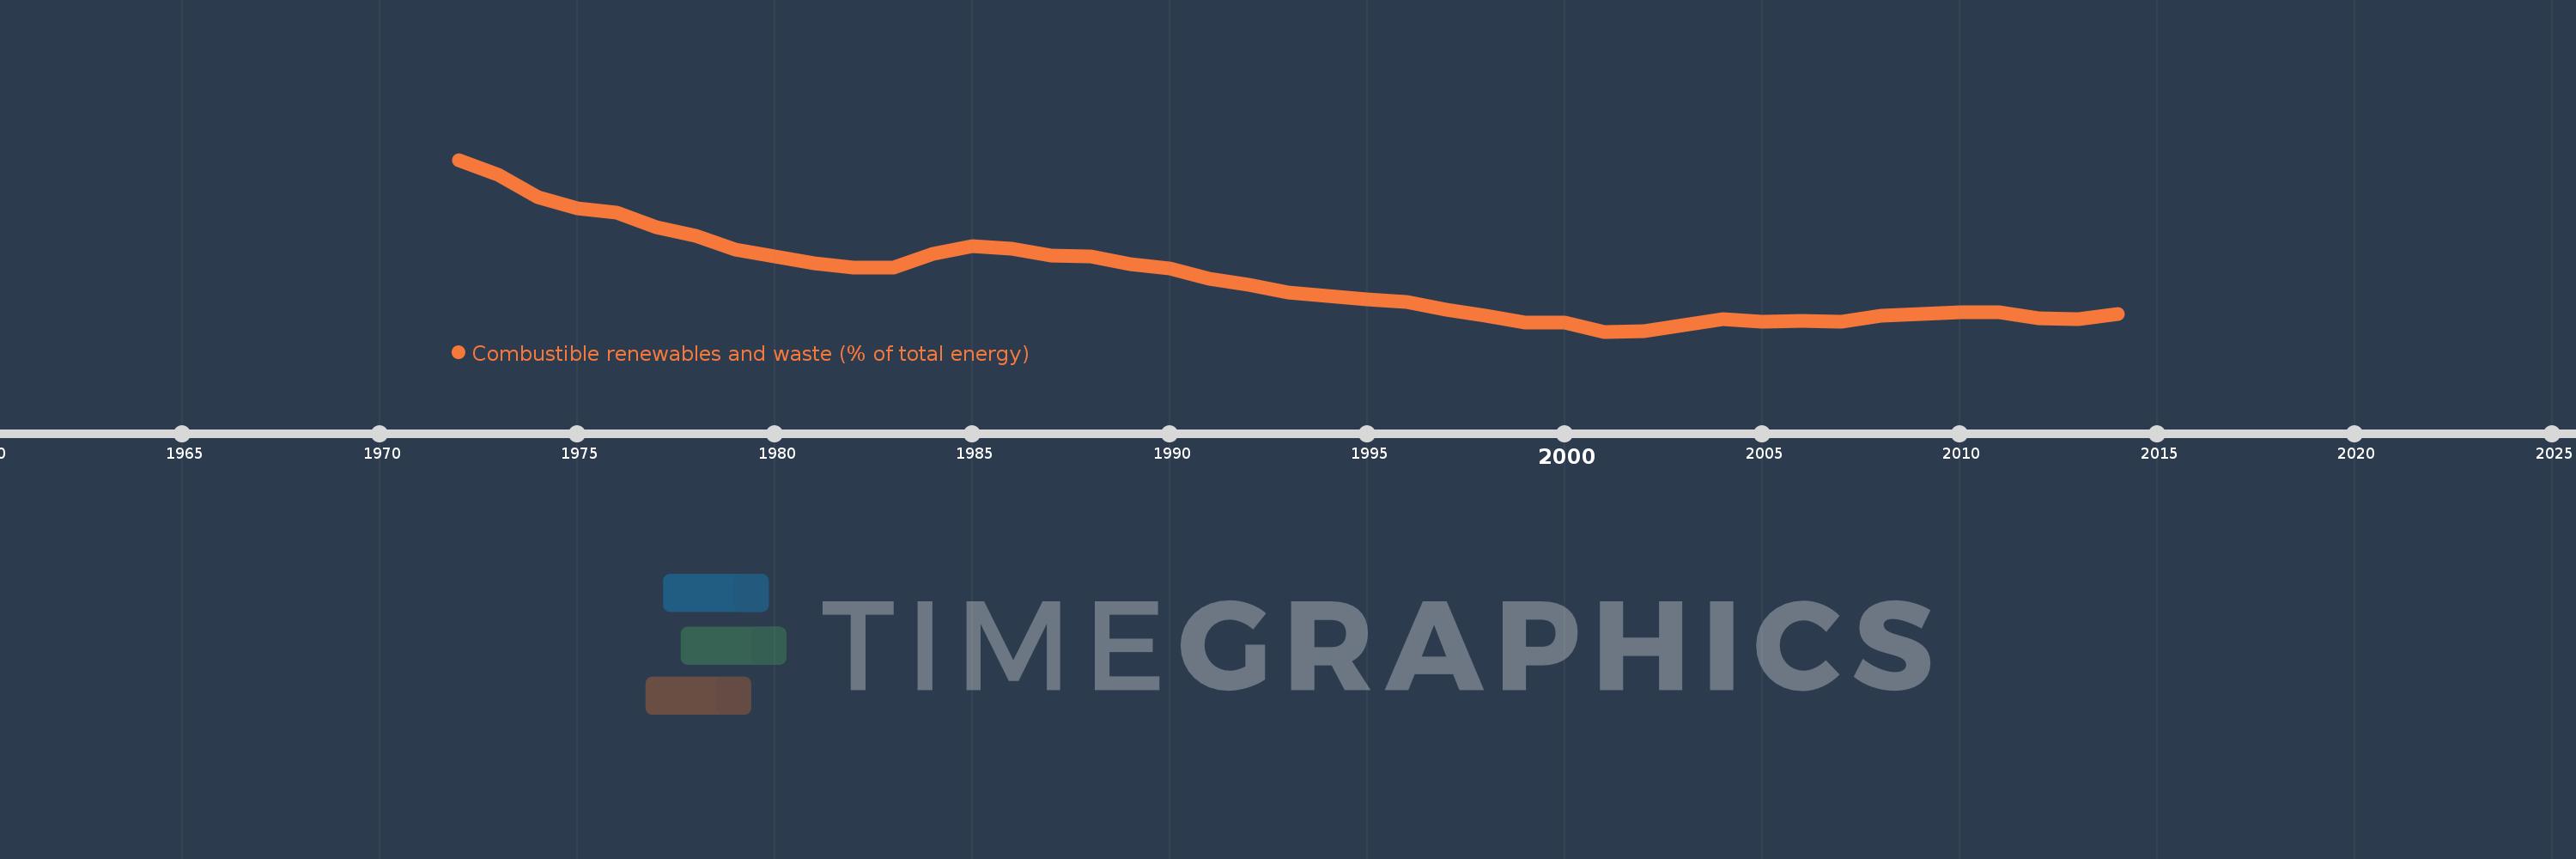
Combustible renewables and waste (% of total energy)
2014,2013,2012,2011,2010,2009,2008,2007,2006,2005,2004,2003,2002,2001,2000,1999,1998,1997,1996,1995,1994,1993,1992,1991,1990,1989,1988,1987,1986,1985,1984,1983,1982,1981,1980,1979,1978,1977,1976,1975,1974,1973,1972
This statistics in other country:
AlbaniaAlgeriaAngolaArab WorldArgentinaArmeniaAustraliaAustriaAzerbaijanBahrainBangladeshBelarusBelgiumBeninBoliviaBosnia and HerzegovinaBotswanaBrazilBrunei DarussalamBulgariaCambodiaCameroonCanadaCaribbean small statesCentral Europe and the BalticsChileChinaColombiaCongo, Dem. Rep.Congo, Rep.Costa RicaCote d'IvoireCroatiaCubaCuracaoCyprusCzech RepublicDenmarkDominican RepublicEarly-demographic dividendEast Asia & PacificEast Asia & Pacific (excluding high income)East Asia & Pacific (IDA & IBRD countries)EcuadorEgypt, Arab Rep.El SalvadorEritreaEstoniaEthiopiaEuro areaEurope & Central AsiaEurope & Central Asia (excluding high income)Europe & Central Asia (IDA & IBRD countries)European UnionFinlandFragile and conflict affected situationsFranceGabonGeorgiaGermanyGhanaGibraltarGreeceGuatemalaHaitiHeavily indebted poor countries (HIPC)High incomeHondurasHong Kong SAR, ChinaHungaryIBRD onlyIcelandIDA & IBRD totalIDA blendIDA onlyIDA totalIndiaIndonesiaIran, Islamic Rep.IraqIrelandIsraelItalyJamaicaJapanJordanKazakhstanKenyaKorea, Dem. People’s Rep.Korea, Rep.KosovoKuwaitKyrgyz RepublicLate-demographic dividendLatin America & Caribbean Latin America & Caribbean (excluding high income)Latin America & the Caribbean (IDA & IBRD countries)LatviaLeast developed countries: UN classificationLebanonLibyaLithuaniaLow & middle incomeLow incomeLower middle incomeLuxembourgMacedonia, FYRMalaysiaMaltaMauritiusMexicoMiddle East & North AfricaMiddle East & North Africa (excluding high income)Middle East & North Africa (IDA & IBRD countries)Middle incomeMoldovaMongoliaMontenegroMoroccoMozambiqueMyanmarNamibiaNepalNetherlandsNew ZealandNicaraguaNigerNigeriaNorth AmericaNorwayOECD membersOmanOther small statesPakistanPanamaParaguayPeruPhilippinesPolandPortugalPost-demographic dividendPre-demographic dividendQatarRomaniaRussian FederationSaudi ArabiaSenegalSerbiaSingaporeSlovak RepublicSloveniaSmall statesSouth AfricaSouth AsiaSouth Asia (IDA & IBRD)South SudanSpainSri LankaSub-Saharan Africa Sub-Saharan Africa (excluding high income)Sub-Saharan Africa (IDA & IBRD countries)SudanSwedenSwitzerlandSyrian Arab RepublicTajikistanTanzaniaThailandTogoTrinidad and TobagoTunisiaTurkeyTurkmenistanUkraineUnited Arab EmiratesUnited KingdomUnited StatesUpper middle incomeUruguayUzbekistanVenezuela, RBVietnamWorldYemen, Rep.ZambiaZimbabwe Timeline:
This timeline shows a graph from 1972 to 2014 of Latin America & the Caribbean (IDA & IBRD countries). No data until 1971. Number of actual observations by date: 43.
Source name:
World Development Indicators
Source organization:
IEA Statistics © OECD/IEA 2014 (http://www.iea.org/stats/index.asp), subject to https://www.iea.org/t&c/termsandconditions/
Categories, topics:
Energy & Mining
Last updated:
apr 23, 2017
Indicators value changes by year
Minimum:
14.816
jan 1, 2001
Maximum:
29.245
jan 1, 1972
At the date of observation
Value
Absolute change
Change from previous value
jan 1, 1972
29.245
+29.245
0.0%
jan 1, 1973
28.008
-1.237
-4.23%
jan 1, 1974
26.093
-1.914
-6.84%
jan 1, 1975
25.165
-0.928
-3.56%
jan 1, 1976
24.813
-0.352
-1.4%
jan 1, 1977
23.569
-1.244
-5.01%
jan 1, 1978
22.858
-0.711
-3.02%
jan 1, 1979
21.736
-1.122
-4.91%
jan 1, 1980
21.157
-0.579
-2.66%
jan 1, 1981
20.537
-0.619
-2.93%
jan 1, 1982
20.222
-0.315
-1.53%
jan 1, 1983
20.195
-0.027
-0.14%
jan 1, 1984
21.377
+1.182
5.85%
jan 1, 1985
21.971
+0.594
2.78%
jan 1, 1986
21.77
-0.2
-0.91%
jan 1, 1987
21.19
-0.581
-2.67%
jan 1, 1988
21.121
-0.069
-0.32%
jan 1, 1989
20.499
-0.622
-2.94%
jan 1, 1990
20.154
-0.345
-1.68%
jan 1, 1991
19.278
-0.876
-4.35%
jan 1, 1992
18.775
-0.503
-2.61%
jan 1, 1993
18.088
-0.688
-3.66%
jan 1, 1994
17.825
-0.263
-1.45%
jan 1, 1995
17.516
-0.309
-1.74%
jan 1, 1996
17.28
-0.236
-1.35%
jan 1, 1997
16.628
-0.652
-3.77%
jan 1, 1998
16.135
-0.492
-2.96%
jan 1, 1999
15.6
-0.536
-3.32%
jan 1, 2000
15.574
-0.026
-0.17%
jan 1, 2001
14.816
-0.758
-4.87%
jan 1, 2002
14.845
+0.029
0.2%
jan 1, 2003
15.323
+0.478
3.22%
jan 1, 2004
15.832
+0.509
3.32%
jan 1, 2005
15.614
-0.217
-1.37%
jan 1, 2006
15.724
+0.11
0.7%
jan 1, 2007
15.662
-0.062
-0.39%
jan 1, 2008
16.182
+0.52
3.32%
jan 1, 2009
16.303
+0.121
0.75%
jan 1, 2010
16.417
+0.114
0.7%
jan 1, 2011
16.465
+0.047
0.29%
jan 1, 2012
15.91
-0.554
-3.37%
jan 1, 2013
15.861
-0.049
-0.31%
jan 1, 2014
16.296
+0.435
2.74%
Ranking of countries by current statistics by years


Comments: