29
/
en
AIzaSyAYiBZKx7MnpbEhh9jyipgxe19OcubqV5w
April 1, 2024
223315
Philippines
PHL
true
2
1
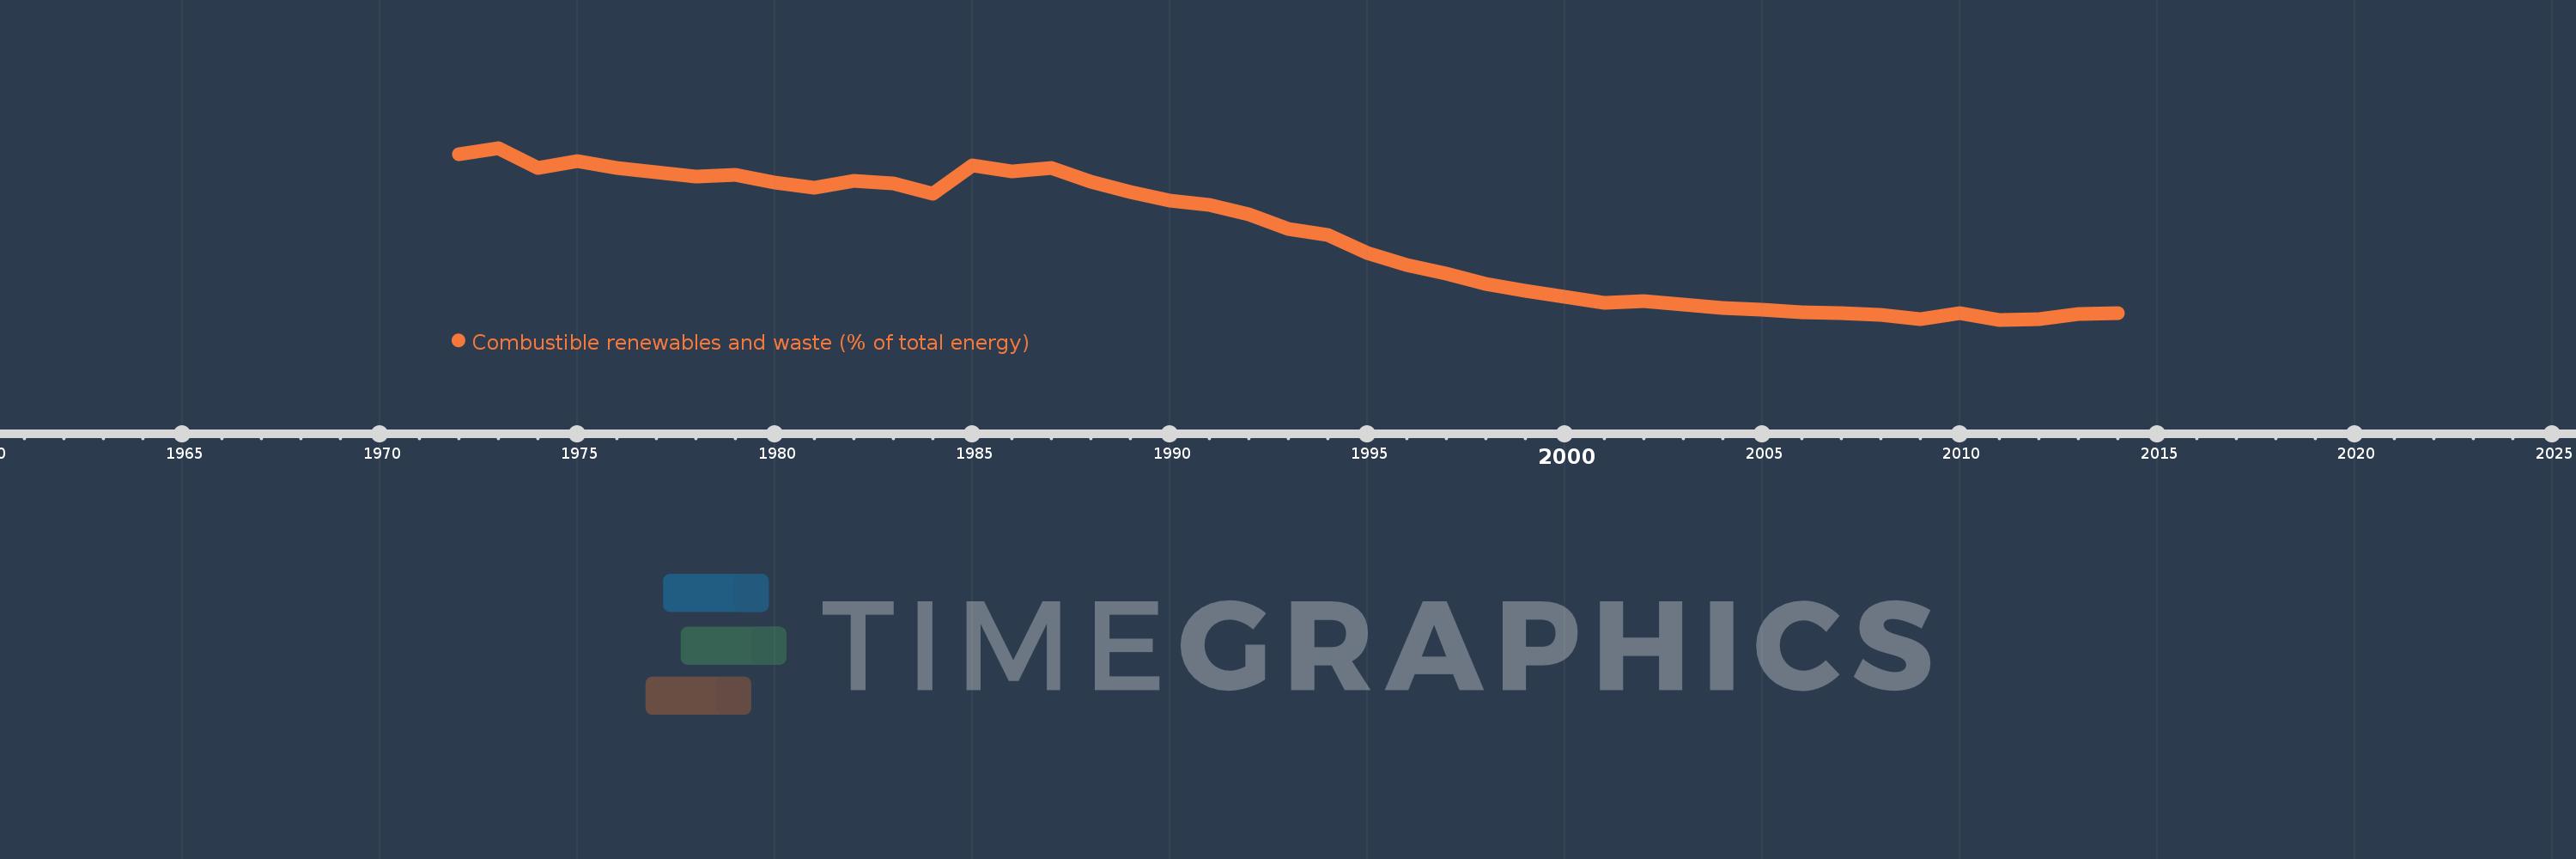
Combustible renewables and waste (% of total energy)
2014,2013,2012,2011,2010,2009,2008,2007,2006,2005,2004,2003,2002,2001,2000,1999,1998,1997,1996,1995,1994,1993,1992,1991,1990,1989,1988,1987,1986,1985,1984,1983,1982,1981,1980,1979,1978,1977,1976,1975,1974,1973,1972
This statistics in other country:
AlbaniaAlgeriaAngolaArab WorldArgentinaArmeniaAustraliaAustriaAzerbaijanBahrainBangladeshBelarusBelgiumBeninBoliviaBosnia and HerzegovinaBotswanaBrazilBrunei DarussalamBulgariaCambodiaCameroonCanadaCaribbean small statesCentral Europe and the BalticsChileChinaColombiaCongo, Dem. Rep.Congo, Rep.Costa RicaCote d'IvoireCroatiaCubaCuracaoCyprusCzech RepublicDenmarkDominican RepublicEarly-demographic dividendEast Asia & PacificEast Asia & Pacific (excluding high income)East Asia & Pacific (IDA & IBRD countries)EcuadorEgypt, Arab Rep.El SalvadorEritreaEstoniaEthiopiaEuro areaEurope & Central AsiaEurope & Central Asia (excluding high income)Europe & Central Asia (IDA & IBRD countries)European UnionFinlandFragile and conflict affected situationsFranceGabonGeorgiaGermanyGhanaGibraltarGreeceGuatemalaHaitiHeavily indebted poor countries (HIPC)High incomeHondurasHong Kong SAR, ChinaHungaryIBRD onlyIcelandIDA & IBRD totalIDA blendIDA onlyIDA totalIndiaIndonesiaIran, Islamic Rep.IraqIrelandIsraelItalyJamaicaJapanJordanKazakhstanKenyaKorea, Dem. People’s Rep.Korea, Rep.KosovoKuwaitKyrgyz RepublicLate-demographic dividendLatin America & Caribbean Latin America & Caribbean (excluding high income)Latin America & the Caribbean (IDA & IBRD countries)LatviaLeast developed countries: UN classificationLebanonLibyaLithuaniaLow & middle incomeLow incomeLower middle incomeLuxembourgMacedonia, FYRMalaysiaMaltaMauritiusMexicoMiddle East & North AfricaMiddle East & North Africa (excluding high income)Middle East & North Africa (IDA & IBRD countries)Middle incomeMoldovaMongoliaMontenegroMoroccoMozambiqueMyanmarNamibiaNepalNetherlandsNew ZealandNicaraguaNigerNigeriaNorth AmericaNorwayOECD membersOmanOther small statesPakistanPanamaParaguayPeruPhilippinesPolandPortugalPost-demographic dividendPre-demographic dividendQatarRomaniaRussian FederationSaudi ArabiaSenegalSerbiaSingaporeSlovak RepublicSloveniaSmall statesSouth AfricaSouth AsiaSouth Asia (IDA & IBRD)South SudanSpainSri LankaSub-Saharan Africa Sub-Saharan Africa (excluding high income)Sub-Saharan Africa (IDA & IBRD countries)SudanSwedenSwitzerlandSyrian Arab RepublicTajikistanTanzaniaThailandTogoTrinidad and TobagoTunisiaTurkeyTurkmenistanUkraineUnited Arab EmiratesUnited KingdomUnited StatesUpper middle incomeUruguayUzbekistanVenezuela, RBVietnamWorldYemen, Rep.ZambiaZimbabwe Timeline:
This timeline shows a graph from 1972 to 2014 of Philippines. No data until 1971. Number of actual observations by date: 43.
Source name:
World Development Indicators
Source organization:
IEA Statistics © OECD/IEA 2014 (http://www.iea.org/stats/index.asp), subject to https://www.iea.org/t&c/termsandconditions/
Categories, topics:
Energy & Mining
Last updated:
apr 23, 2017
Indicators value changes by year
Minimum:
17.085
jan 1, 2011
Maximum:
49.457
jan 1, 1973
At the date of observation
Value
Absolute change
Change from previous value
jan 1, 1972
48.317
+48.317
0.0%
jan 1, 1973
49.457
+1.14
2.36%
jan 1, 1974
45.752
-3.705
-7.49%
jan 1, 1975
47.013
+1.26
2.75%
jan 1, 1976
45.678
-1.334
-2.84%
jan 1, 1977
44.901
-0.778
-1.7%
jan 1, 1978
44.1
-0.8
-1.78%
jan 1, 1979
44.388
+0.288
0.65%
jan 1, 1980
42.885
-1.504
-3.39%
jan 1, 1981
42.032
-0.853
-1.99%
jan 1, 1982
43.195
+1.163
2.77%
jan 1, 1983
42.784
-0.411
-0.95%
jan 1, 1984
40.898
-1.886
-4.41%
jan 1, 1985
46.167
+5.269
12.88%
jan 1, 1986
44.975
-1.192
-2.58%
jan 1, 1987
45.722
+0.748
1.66%
jan 1, 1988
43.069
-2.653
-5.8%
jan 1, 1989
41.146
-1.924
-4.47%
jan 1, 1990
39.513
-1.633
-3.97%
jan 1, 1991
38.737
-0.776
-1.96%
jan 1, 1992
36.909
-1.828
-4.72%
jan 1, 1993
34.147
-2.762
-7.48%
jan 1, 1994
33.016
-1.131
-3.31%
jan 1, 1995
29.73
-3.286
-9.95%
jan 1, 1996
27.348
-2.382
-8.01%
jan 1, 1997
25.772
-1.576
-5.76%
jan 1, 1998
23.85
-1.922
-7.46%
jan 1, 1999
22.562
-1.288
-5.4%
jan 1, 2000
21.471
-1.091
-4.83%
jan 1, 2001
20.261
-1.21
-5.64%
jan 1, 2002
20.656
+0.395
1.95%
jan 1, 2003
19.884
-0.772
-3.74%
jan 1, 2004
19.346
-0.538
-2.71%
jan 1, 2005
18.924
-0.422
-2.18%
jan 1, 2006
18.418
-0.507
-2.68%
jan 1, 2007
18.264
-0.154
-0.83%
jan 1, 2008
18.084
-0.18
-0.99%
jan 1, 2009
17.261
-0.823
-4.55%
jan 1, 2010
18.276
+1.015
5.88%
jan 1, 2011
17.085
-1.191
-6.52%
jan 1, 2012
17.167
+0.082
0.48%
jan 1, 2013
18.176
+1.009
5.88%
jan 1, 2014
18.296
+0.121
0.66%
Ranking of countries by current statistics by years


Comments: