29
/
en
AIzaSyAYiBZKx7MnpbEhh9jyipgxe19OcubqV5w
April 1, 2024
116705
Cyprus
CYP
true
2
1
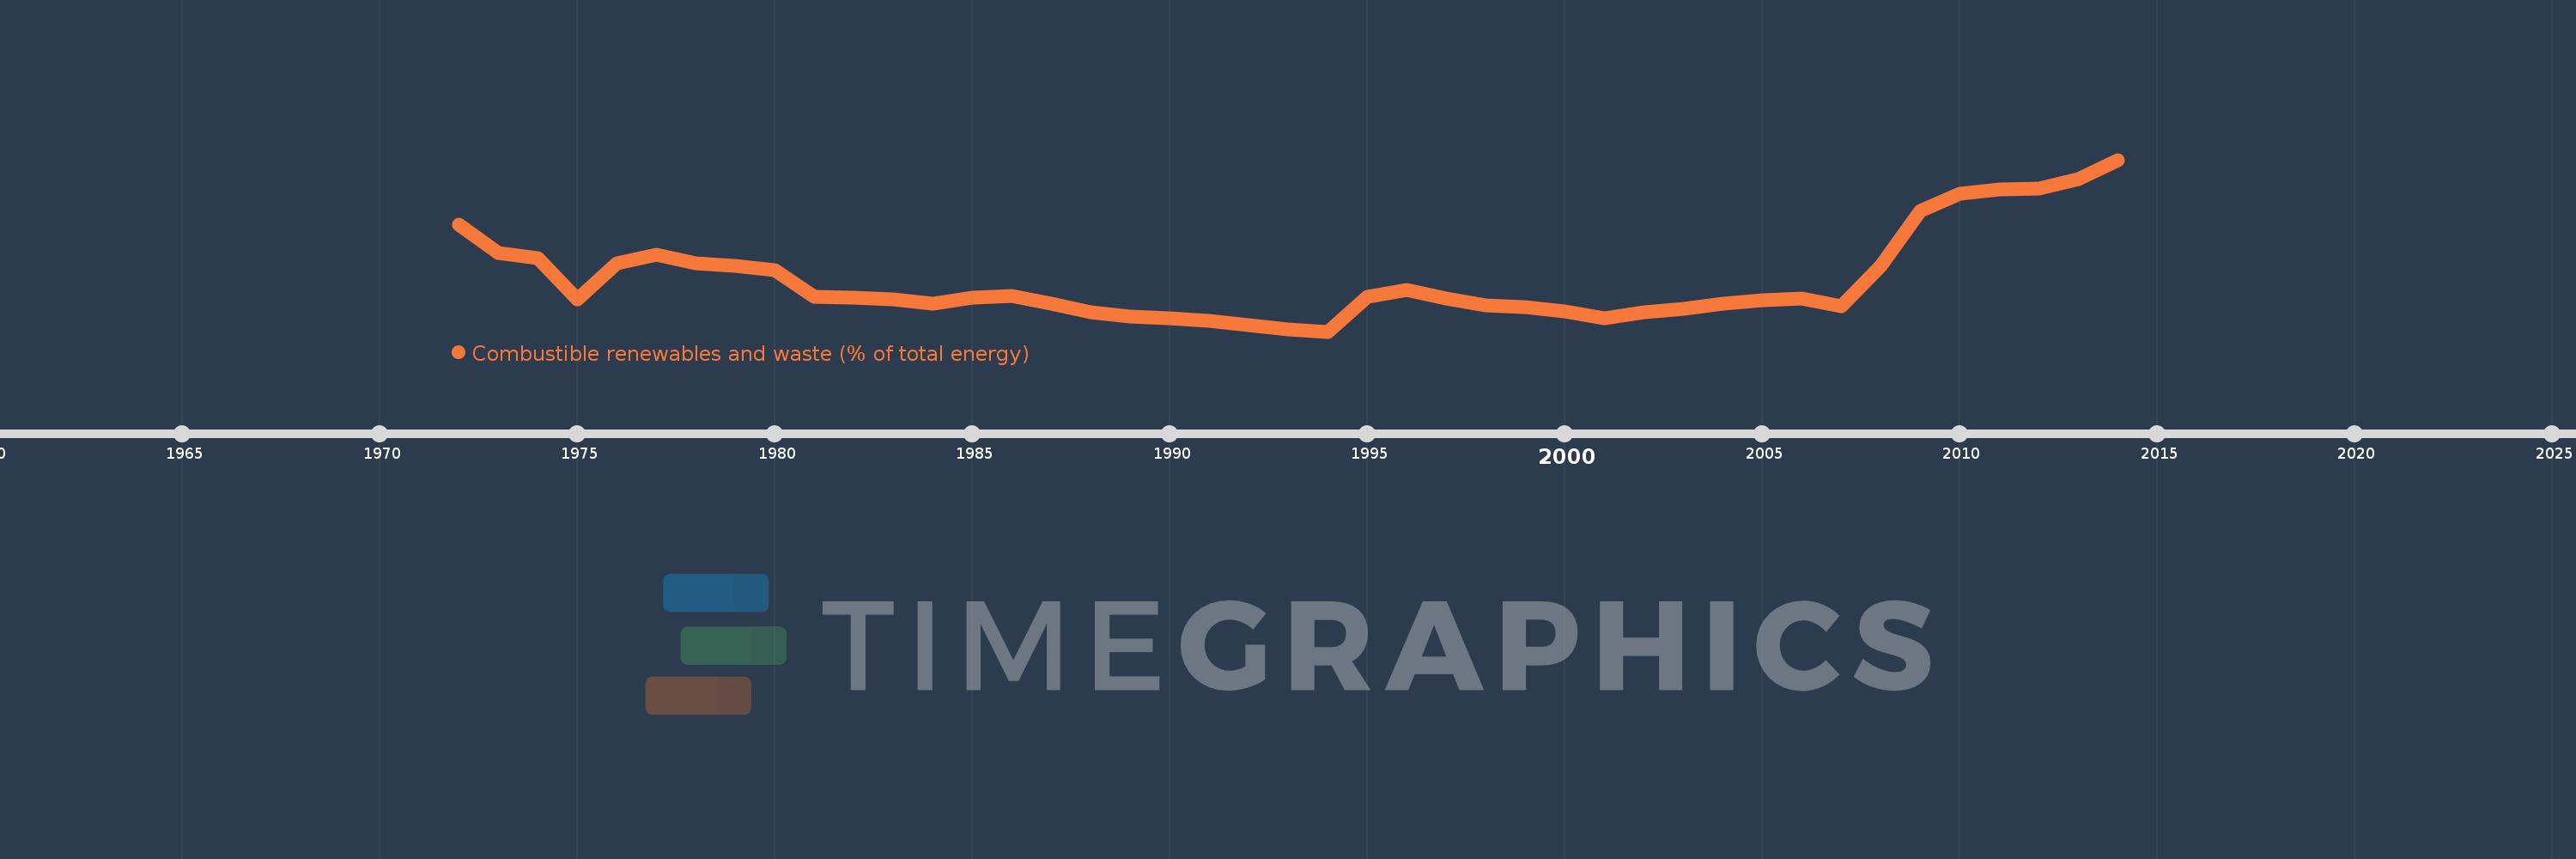
Combustible renewables and waste (% of total energy)
2014,2013,2012,2011,2010,2009,2008,2007,2006,2005,2004,2003,2002,2001,2000,1999,1998,1997,1996,1995,1994,1993,1992,1991,1990,1989,1988,1987,1986,1985,1984,1983,1982,1981,1980,1979,1978,1977,1976,1975,1974,1973,1972
This statistics in other country:
AlbaniaAlgeriaAngolaArab WorldArgentinaArmeniaAustraliaAustriaAzerbaijanBahrainBangladeshBelarusBelgiumBeninBoliviaBosnia and HerzegovinaBotswanaBrazilBrunei DarussalamBulgariaCambodiaCameroonCanadaCaribbean small statesCentral Europe and the BalticsChileChinaColombiaCongo, Dem. Rep.Congo, Rep.Costa RicaCote d'IvoireCroatiaCubaCuracaoCyprusCzech RepublicDenmarkDominican RepublicEarly-demographic dividendEast Asia & PacificEast Asia & Pacific (excluding high income)East Asia & Pacific (IDA & IBRD countries)EcuadorEgypt, Arab Rep.El SalvadorEritreaEstoniaEthiopiaEuro areaEurope & Central AsiaEurope & Central Asia (excluding high income)Europe & Central Asia (IDA & IBRD countries)European UnionFinlandFragile and conflict affected situationsFranceGabonGeorgiaGermanyGhanaGibraltarGreeceGuatemalaHaitiHeavily indebted poor countries (HIPC)High incomeHondurasHong Kong SAR, ChinaHungaryIBRD onlyIcelandIDA & IBRD totalIDA blendIDA onlyIDA totalIndiaIndonesiaIran, Islamic Rep.IraqIrelandIsraelItalyJamaicaJapanJordanKazakhstanKenyaKorea, Dem. People’s Rep.Korea, Rep.KosovoKuwaitKyrgyz RepublicLate-demographic dividendLatin America & Caribbean Latin America & Caribbean (excluding high income)Latin America & the Caribbean (IDA & IBRD countries)LatviaLeast developed countries: UN classificationLebanonLibyaLithuaniaLow & middle incomeLow incomeLower middle incomeLuxembourgMacedonia, FYRMalaysiaMaltaMauritiusMexicoMiddle East & North AfricaMiddle East & North Africa (excluding high income)Middle East & North Africa (IDA & IBRD countries)Middle incomeMoldovaMongoliaMontenegroMoroccoMozambiqueMyanmarNamibiaNepalNetherlandsNew ZealandNicaraguaNigerNigeriaNorth AmericaNorwayOECD membersOmanOther small statesPakistanPanamaParaguayPeruPhilippinesPolandPortugalPost-demographic dividendPre-demographic dividendQatarRomaniaRussian FederationSaudi ArabiaSenegalSerbiaSingaporeSlovak RepublicSloveniaSmall statesSouth AfricaSouth AsiaSouth Asia (IDA & IBRD)South SudanSpainSri LankaSub-Saharan Africa Sub-Saharan Africa (excluding high income)Sub-Saharan Africa (IDA & IBRD countries)SudanSwedenSwitzerlandSyrian Arab RepublicTajikistanTanzaniaThailandTogoTrinidad and TobagoTunisiaTurkeyTurkmenistanUkraineUnited Arab EmiratesUnited KingdomUnited StatesUpper middle incomeUruguayUzbekistanVenezuela, RBVietnamWorldYemen, Rep.ZambiaZimbabwe Timeline:
This timeline shows a graph from 1972 to 2014 of Cyprus. No data until 1971. Number of actual observations by date: 43.
Source name:
World Development Indicators
Source organization:
IEA Statistics © OECD/IEA 2014 (http://www.iea.org/stats/index.asp), subject to https://www.iea.org/t&c/termsandconditions/
Categories, topics:
Energy & Mining
Last updated:
apr 23, 2017
Indicators value changes by year
At the date of observation
Value
Absolute change
Change from previous value
jan 1, 1972
1.553
+1.553
0.0%
jan 1, 1973
1.222
-0.331
-21.33%
jan 1, 1974
1.167
-0.055
-4.54%
jan 1, 1975
0.691
-0.475
-40.73%
jan 1, 1976
1.108
+0.417
60.24%
jan 1, 1977
1.208
+0.1
9.0%
jan 1, 1978
1.109
-0.099
-8.18%
jan 1, 1979
1.08
-0.029
-2.62%
jan 1, 1980
1.023
-0.057
-5.24%
jan 1, 1981
0.724
-0.299
-29.27%
jan 1, 1982
0.709
-0.015
-2.06%
jan 1, 1983
0.697
-0.011
-1.62%
jan 1, 1984
0.645
-0.052
-7.47%
jan 1, 1985
0.714
+0.069
10.72%
jan 1, 1986
0.732
+0.018
2.51%
jan 1, 1987
0.647
-0.085
-11.61%
jan 1, 1988
0.549
-0.098
-15.19%
jan 1, 1989
0.498
-0.051
-9.36%
jan 1, 1990
0.478
-0.019
-3.91%
jan 1, 1991
0.45
-0.029
-5.97%
jan 1, 1992
0.398
-0.052
-11.54%
jan 1, 1993
0.35
-0.047
-11.94%
jan 1, 1994
0.325
-0.025
-7.25%
jan 1, 1995
0.723
+0.398
122.56%
jan 1, 1996
0.805
+0.082
11.37%
jan 1, 1997
0.705
-0.1
-12.42%
jan 1, 1998
0.622
-0.083
-11.73%
jan 1, 1999
0.606
-0.017
-2.69%
jan 1, 2000
0.555
-0.051
-8.42%
jan 1, 2001
0.479
-0.076
-13.65%
jan 1, 2002
0.545
+0.066
13.81%
jan 1, 2003
0.582
+0.037
6.75%
jan 1, 2004
0.64
+0.058
10.04%
jan 1, 2005
0.686
+0.046
7.21%
jan 1, 2006
0.704
+0.018
2.58%
jan 1, 2007
0.615
-0.089
-12.67%
jan 1, 2008
1.074
+0.459
74.6%
jan 1, 2009
1.704
+0.631
58.75%
jan 1, 2010
1.898
+0.193
11.33%
jan 1, 2011
1.956
+0.058
3.08%
jan 1, 2012
1.957
+0.001
0.03%
jan 1, 2013
2.073
+0.116
5.94%
jan 1, 2014
2.291
+0.218
10.54%
Ranking of countries by current statistics by years


Comments: