29
/
en
AIzaSyAYiBZKx7MnpbEhh9jyipgxe19OcubqV5w
April 1, 2024
144124
Guatemala
GTM
true
2
1
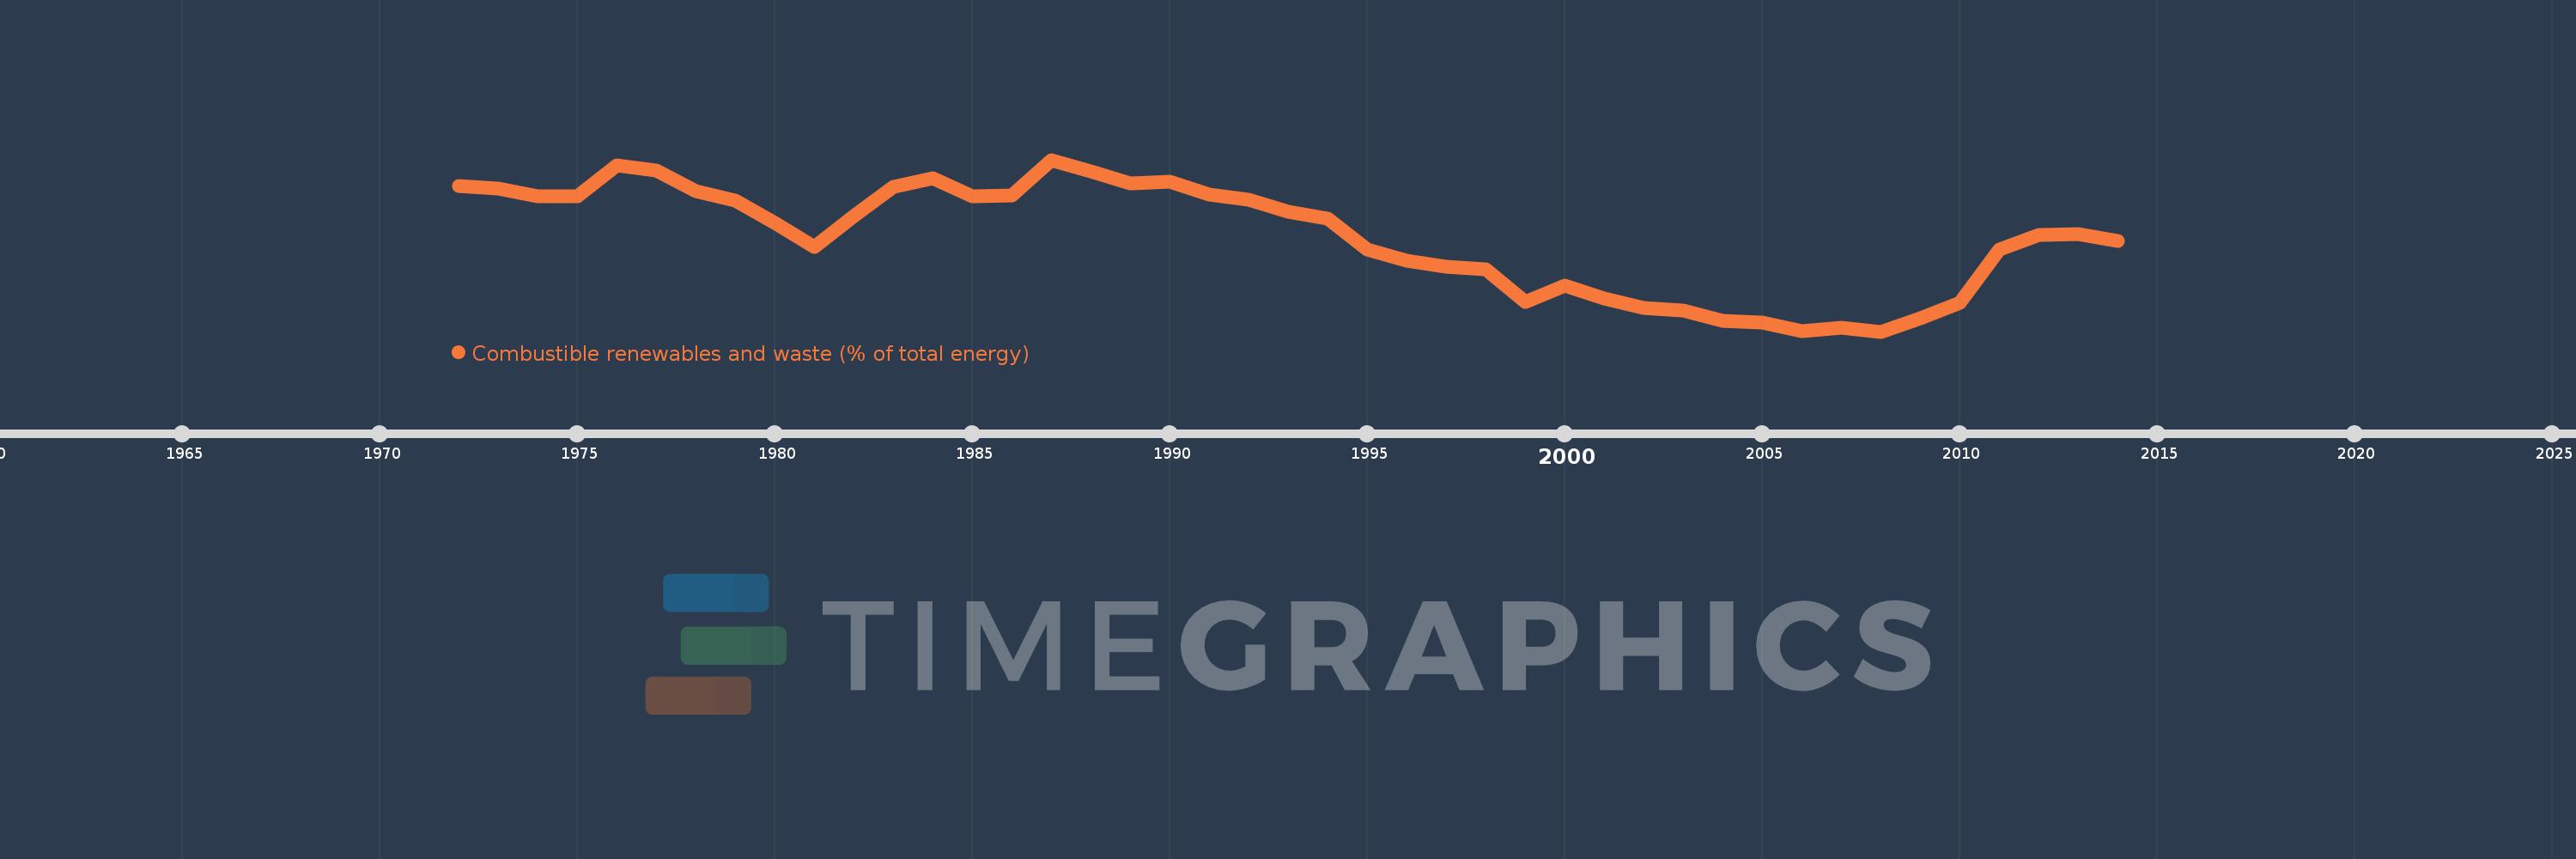
Combustible renewables and waste (% of total energy)
2014,2013,2012,2011,2010,2009,2008,2007,2006,2005,2004,2003,2002,2001,2000,1999,1998,1997,1996,1995,1994,1993,1992,1991,1990,1989,1988,1987,1986,1985,1984,1983,1982,1981,1980,1979,1978,1977,1976,1975,1974,1973,1972
This statistics in other country:
AlbaniaAlgeriaAngolaArab WorldArgentinaArmeniaAustraliaAustriaAzerbaijanBahrainBangladeshBelarusBelgiumBeninBoliviaBosnia and HerzegovinaBotswanaBrazilBrunei DarussalamBulgariaCambodiaCameroonCanadaCaribbean small statesCentral Europe and the BalticsChileChinaColombiaCongo, Dem. Rep.Congo, Rep.Costa RicaCote d'IvoireCroatiaCubaCuracaoCyprusCzech RepublicDenmarkDominican RepublicEarly-demographic dividendEast Asia & PacificEast Asia & Pacific (excluding high income)East Asia & Pacific (IDA & IBRD countries)EcuadorEgypt, Arab Rep.El SalvadorEritreaEstoniaEthiopiaEuro areaEurope & Central AsiaEurope & Central Asia (excluding high income)Europe & Central Asia (IDA & IBRD countries)European UnionFinlandFragile and conflict affected situationsFranceGabonGeorgiaGermanyGhanaGibraltarGreeceGuatemalaHaitiHeavily indebted poor countries (HIPC)High incomeHondurasHong Kong SAR, ChinaHungaryIBRD onlyIcelandIDA & IBRD totalIDA blendIDA onlyIDA totalIndiaIndonesiaIran, Islamic Rep.IraqIrelandIsraelItalyJamaicaJapanJordanKazakhstanKenyaKorea, Dem. People’s Rep.Korea, Rep.KosovoKuwaitKyrgyz RepublicLate-demographic dividendLatin America & Caribbean Latin America & Caribbean (excluding high income)Latin America & the Caribbean (IDA & IBRD countries)LatviaLeast developed countries: UN classificationLebanonLibyaLithuaniaLow & middle incomeLow incomeLower middle incomeLuxembourgMacedonia, FYRMalaysiaMaltaMauritiusMexicoMiddle East & North AfricaMiddle East & North Africa (excluding high income)Middle East & North Africa (IDA & IBRD countries)Middle incomeMoldovaMongoliaMontenegroMoroccoMozambiqueMyanmarNamibiaNepalNetherlandsNew ZealandNicaraguaNigerNigeriaNorth AmericaNorwayOECD membersOmanOther small statesPakistanPanamaParaguayPeruPhilippinesPolandPortugalPost-demographic dividendPre-demographic dividendQatarRomaniaRussian FederationSaudi ArabiaSenegalSerbiaSingaporeSlovak RepublicSloveniaSmall statesSouth AfricaSouth AsiaSouth Asia (IDA & IBRD)South SudanSpainSri LankaSub-Saharan Africa Sub-Saharan Africa (excluding high income)Sub-Saharan Africa (IDA & IBRD countries)SudanSwedenSwitzerlandSyrian Arab RepublicTajikistanTanzaniaThailandTogoTrinidad and TobagoTunisiaTurkeyTurkmenistanUkraineUnited Arab EmiratesUnited KingdomUnited StatesUpper middle incomeUruguayUzbekistanVenezuela, RBVietnamWorldYemen, Rep.ZambiaZimbabwe Timeline:
This timeline shows a graph from 1972 to 2014 of Guatemala. No data until 1971. Number of actual observations by date: 43.
Source name:
World Development Indicators
Source organization:
IEA Statistics © OECD/IEA 2014 (http://www.iea.org/stats/index.asp), subject to https://www.iea.org/t&c/termsandconditions/
Categories, topics:
Energy & Mining
Last updated:
apr 23, 2017
Indicators value changes by year
Minimum:
51.002
jan 1, 2008
Maximum:
73.338
jan 1, 1987
At the date of observation
Value
Absolute change
Change from previous value
jan 1, 1972
69.899
+69.899
0.0%
jan 1, 1973
69.636
-0.263
-0.38%
jan 1, 1974
68.619
-1.017
-1.46%
jan 1, 1975
68.585
-0.035
-0.05%
jan 1, 1976
72.63
+4.045
5.9%
jan 1, 1977
71.934
-0.696
-0.96%
jan 1, 1978
69.249
-2.685
-3.73%
jan 1, 1979
68.026
-1.223
-1.77%
jan 1, 1980
65.087
-2.938
-4.32%
jan 1, 1981
62.021
-3.066
-4.71%
jan 1, 1982
66.041
+4.02
6.48%
jan 1, 1983
69.791
+3.75
5.68%
jan 1, 1984
70.894
+1.103
1.58%
jan 1, 1985
68.598
-2.296
-3.24%
jan 1, 1986
68.654
+0.057
0.08%
jan 1, 1987
73.338
+4.684
6.82%
jan 1, 1988
71.8
-1.538
-2.1%
jan 1, 1989
70.287
-1.513
-2.11%
jan 1, 1990
70.452
+0.165
0.24%
jan 1, 1991
68.787
-1.665
-2.36%
jan 1, 1992
68.159
-0.628
-0.91%
jan 1, 1993
66.548
-1.611
-2.36%
jan 1, 1994
65.677
-0.871
-1.31%
jan 1, 1995
61.623
-4.054
-6.17%
jan 1, 1996
60.256
-1.367
-2.22%
jan 1, 1997
59.387
-0.869
-1.44%
jan 1, 1998
59.109
-0.278
-0.47%
jan 1, 1999
54.824
-4.284
-7.25%
jan 1, 2000
56.938
+2.114
3.86%
jan 1, 2001
55.254
-1.684
-2.96%
jan 1, 2002
54.122
-1.132
-2.05%
jan 1, 2003
53.688
-0.435
-0.8%
jan 1, 2004
52.403
-1.284
-2.39%
jan 1, 2005
52.223
-0.18
-0.34%
jan 1, 2006
51.106
-1.118
-2.14%
jan 1, 2007
51.545
+0.44
0.86%
jan 1, 2008
51.002
-0.543
-1.05%
jan 1, 2009
52.735
+1.733
3.4%
jan 1, 2010
54.748
+2.013
3.82%
jan 1, 2011
61.619
+6.872
12.55%
jan 1, 2012
63.593
+1.974
3.2%
jan 1, 2013
63.731
+0.138
0.22%
jan 1, 2014
62.764
-0.967
-1.52%
Ranking of countries by current statistics by years


Comments: