29
/
en
AIzaSyAYiBZKx7MnpbEhh9jyipgxe19OcubqV5w
April 1, 2024
35605
High income
HIC
false
2
1
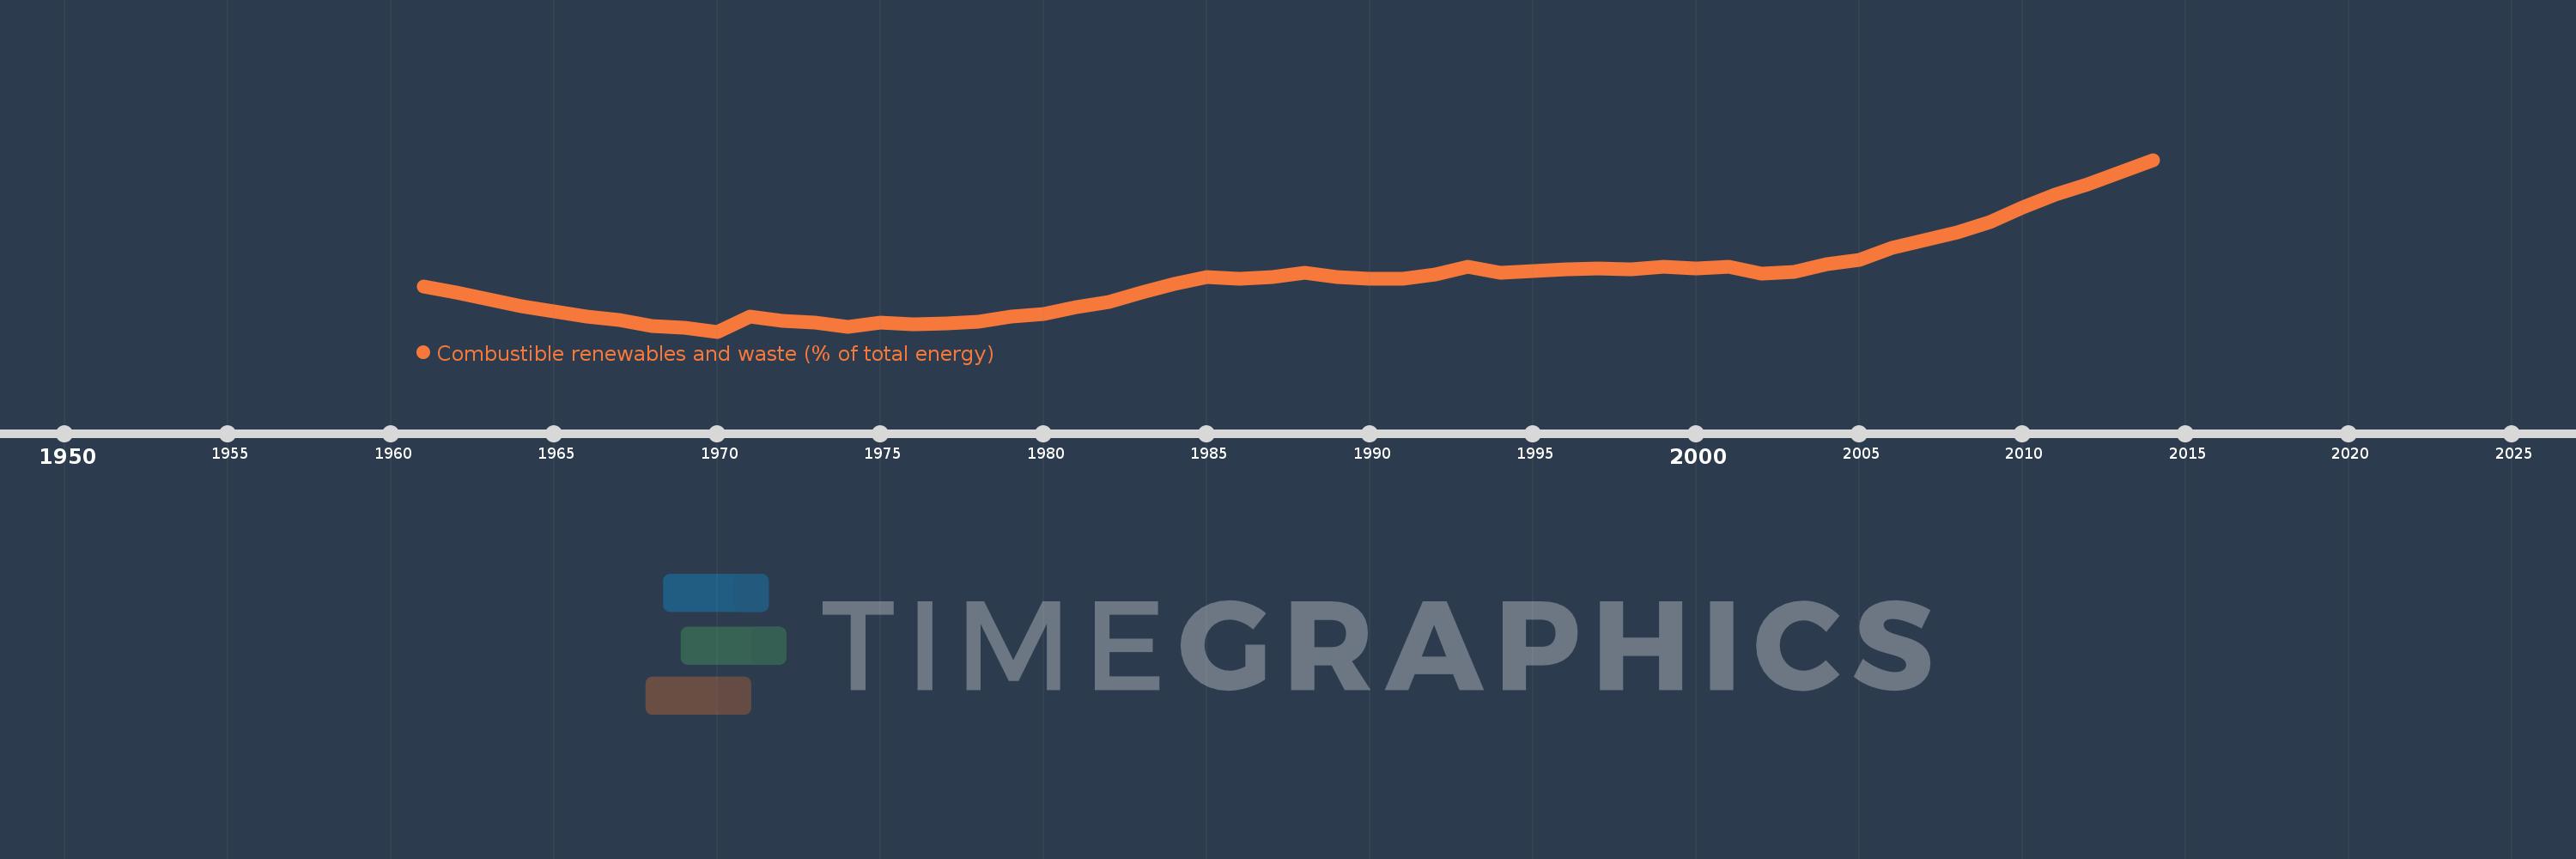
Combustible renewables and waste (% of total energy)
2014,2013,2012,2011,2010,2009,2008,2007,2006,2005,2004,2003,2002,2001,2000,1999,1998,1997,1996,1995,1994,1993,1992,1991,1990,1989,1988,1987,1986,1985,1984,1983,1982,1981,1980,1979,1978,1977,1976,1975,1974,1973,1972,1971,1970,1969,1968,1967,1966,1965,1964,1963,1962,1961
This statistics in other country:
AlbaniaAlgeriaAngolaArab WorldArgentinaArmeniaAustraliaAustriaAzerbaijanBahrainBangladeshBelarusBelgiumBeninBoliviaBosnia and HerzegovinaBotswanaBrazilBrunei DarussalamBulgariaCambodiaCameroonCanadaCaribbean small statesCentral Europe and the BalticsChileChinaColombiaCongo, Dem. Rep.Congo, Rep.Costa RicaCote d'IvoireCroatiaCubaCuracaoCyprusCzech RepublicDenmarkDominican RepublicEarly-demographic dividendEast Asia & PacificEast Asia & Pacific (excluding high income)East Asia & Pacific (IDA & IBRD countries)EcuadorEgypt, Arab Rep.El SalvadorEritreaEstoniaEthiopiaEuro areaEurope & Central AsiaEurope & Central Asia (excluding high income)Europe & Central Asia (IDA & IBRD countries)European UnionFinlandFragile and conflict affected situationsFranceGabonGeorgiaGermanyGhanaGibraltarGreeceGuatemalaHaitiHeavily indebted poor countries (HIPC)High incomeHondurasHong Kong SAR, ChinaHungaryIBRD onlyIcelandIDA & IBRD totalIDA blendIDA onlyIDA totalIndiaIndonesiaIran, Islamic Rep.IraqIrelandIsraelItalyJamaicaJapanJordanKazakhstanKenyaKorea, Dem. People’s Rep.Korea, Rep.KosovoKuwaitKyrgyz RepublicLate-demographic dividendLatin America & Caribbean Latin America & Caribbean (excluding high income)Latin America & the Caribbean (IDA & IBRD countries)LatviaLeast developed countries: UN classificationLebanonLibyaLithuaniaLow & middle incomeLow incomeLower middle incomeLuxembourgMacedonia, FYRMalaysiaMaltaMauritiusMexicoMiddle East & North AfricaMiddle East & North Africa (excluding high income)Middle East & North Africa (IDA & IBRD countries)Middle incomeMoldovaMongoliaMontenegroMoroccoMozambiqueMyanmarNamibiaNepalNetherlandsNew ZealandNicaraguaNigerNigeriaNorth AmericaNorwayOECD membersOmanOther small statesPakistanPanamaParaguayPeruPhilippinesPolandPortugalPost-demographic dividendPre-demographic dividendQatarRomaniaRussian FederationSaudi ArabiaSenegalSerbiaSingaporeSlovak RepublicSloveniaSmall statesSouth AfricaSouth AsiaSouth Asia (IDA & IBRD)South SudanSpainSri LankaSub-Saharan Africa Sub-Saharan Africa (excluding high income)Sub-Saharan Africa (IDA & IBRD countries)SudanSwedenSwitzerlandSyrian Arab RepublicTajikistanTanzaniaThailandTogoTrinidad and TobagoTunisiaTurkeyTurkmenistanUkraineUnited Arab EmiratesUnited KingdomUnited StatesUpper middle incomeUruguayUzbekistanVenezuela, RBVietnamWorldYemen, Rep.ZambiaZimbabwe Timeline:
This timeline shows a graph from 1961 to 2014 of High income. No data until 1960. Number of actual observations by date: 54.
Source name:
World Development Indicators
Source organization:
IEA Statistics © OECD/IEA 2014 (http://www.iea.org/stats/index.asp), subject to https://www.iea.org/t&c/termsandconditions/
Categories, topics:
Energy & Mining
Last updated:
apr 23, 2017
Indicators value changes by year
At the date of observation
Value
Absolute change
Change from previous value
jan 1, 1961
2.773
+2.773
0.0%
jan 1, 1962
2.668
-0.105
-3.8%
jan 1, 1963
2.531
-0.137
-5.15%
jan 1, 1964
2.412
-0.119
-4.69%
jan 1, 1965
2.307
-0.105
-4.34%
jan 1, 1966
2.215
-0.093
-4.02%
jan 1, 1967
2.142
-0.073
-3.29%
jan 1, 1968
2.031
-0.111
-5.18%
jan 1, 1969
2.002
-0.029
-1.41%
jan 1, 1970
1.932
-0.071
-3.52%
jan 1, 1971
2.205
+0.273
14.15%
jan 1, 1972
2.139
-0.066
-3.0%
jan 1, 1973
2.097
-0.041
-1.94%
jan 1, 1974
2.025
-0.073
-3.46%
jan 1, 1975
2.095
+0.07
3.44%
jan 1, 1976
2.065
-0.029
-1.39%
jan 1, 1977
2.085
+0.02
0.96%
jan 1, 1978
2.12
+0.035
1.66%
jan 1, 1979
2.216
+0.097
4.56%
jan 1, 1980
2.259
+0.042
1.9%
jan 1, 1981
2.388
+0.129
5.71%
jan 1, 1982
2.481
+0.093
3.9%
jan 1, 1983
2.667
+0.187
7.53%
jan 1, 1984
2.822
+0.155
5.8%
jan 1, 1985
2.955
+0.133
4.73%
jan 1, 1986
2.926
-0.029
-0.99%
jan 1, 1987
2.944
+0.018
0.6%
jan 1, 1988
3.03
+0.087
2.95%
jan 1, 1989
2.947
-0.084
-2.76%
jan 1, 1990
2.92
-0.026
-0.89%
jan 1, 1991
2.916
-0.004
-0.14%
jan 1, 1992
2.998
+0.082
2.8%
jan 1, 1993
3.145
+0.147
4.89%
jan 1, 1994
3.036
-0.109
-3.46%
jan 1, 1995
3.056
+0.021
0.68%
jan 1, 1996
3.101
+0.044
1.45%
jan 1, 1997
3.106
+0.005
0.18%
jan 1, 1998
3.102
-0.004
-0.13%
jan 1, 1999
3.141
+0.039
1.25%
jan 1, 2000
3.109
-0.032
-1.01%
jan 1, 2001
3.144
+0.035
1.12%
jan 1, 2002
3.016
-0.128
-4.06%
jan 1, 2003
3.053
+0.037
1.21%
jan 1, 2004
3.196
+0.143
4.69%
jan 1, 2005
3.279
+0.084
2.62%
jan 1, 2006
3.502
+0.223
6.8%
jan 1, 2007
3.647
+0.145
4.13%
jan 1, 2008
3.784
+0.137
3.75%
jan 1, 2009
3.983
+0.2
5.28%
jan 1, 2010
4.245
+0.261
6.56%
jan 1, 2011
4.484
+0.24
5.64%
jan 1, 2012
4.68
+0.195
4.35%
jan 1, 2013
4.908
+0.229
4.88%
jan 1, 2014
5.14
+0.231
4.72%
Ranking of countries by current statistics by years


Comments: