29
/
en
AIzaSyAYiBZKx7MnpbEhh9jyipgxe19OcubqV5w
April 1, 2024
57932
South Asia (IDA & IBRD)
TSA
false
2
1
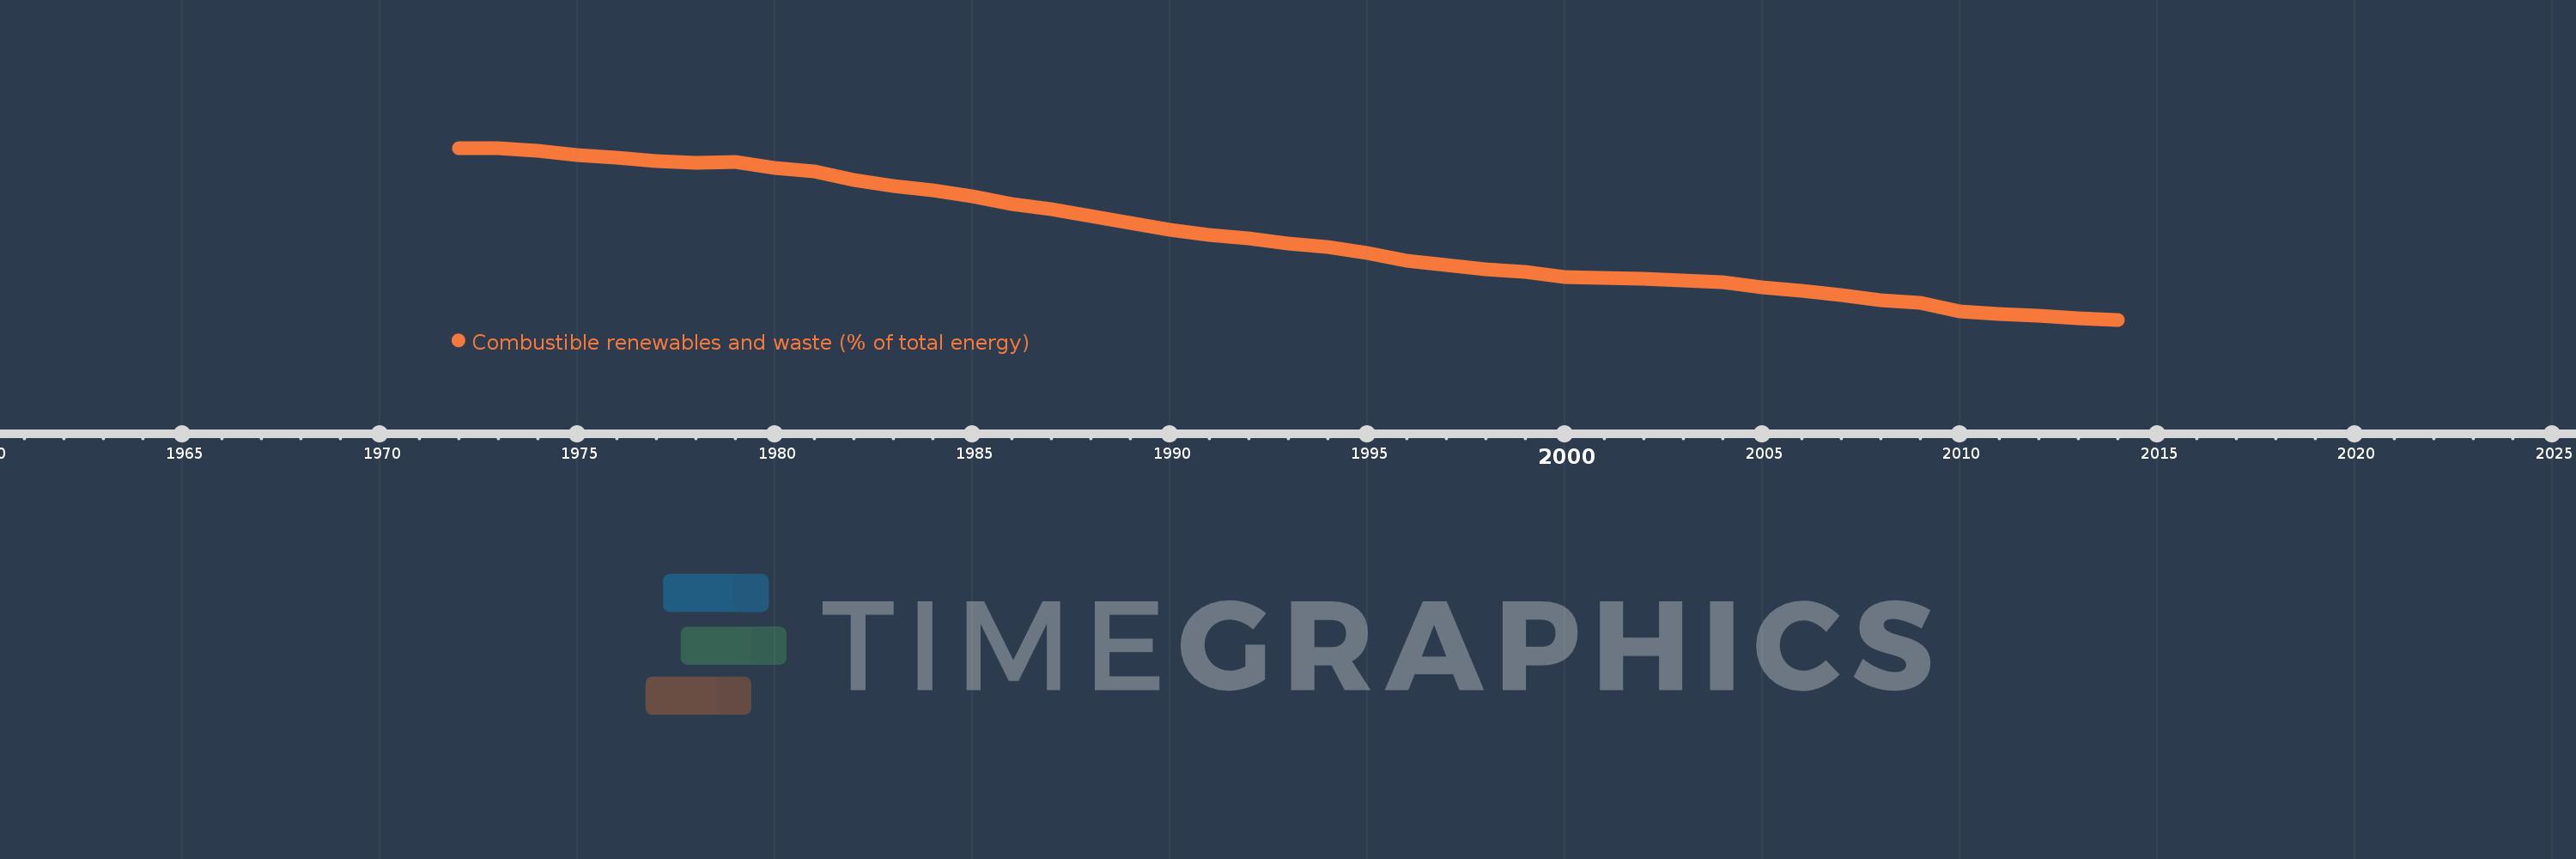
Combustible renewables and waste (% of total energy)
2014,2013,2012,2011,2010,2009,2008,2007,2006,2005,2004,2003,2002,2001,2000,1999,1998,1997,1996,1995,1994,1993,1992,1991,1990,1989,1988,1987,1986,1985,1984,1983,1982,1981,1980,1979,1978,1977,1976,1975,1974,1973,1972
This statistics in other country:
AlbaniaAlgeriaAngolaArab WorldArgentinaArmeniaAustraliaAustriaAzerbaijanBahrainBangladeshBelarusBelgiumBeninBoliviaBosnia and HerzegovinaBotswanaBrazilBrunei DarussalamBulgariaCambodiaCameroonCanadaCaribbean small statesCentral Europe and the BalticsChileChinaColombiaCongo, Dem. Rep.Congo, Rep.Costa RicaCote d'IvoireCroatiaCubaCuracaoCyprusCzech RepublicDenmarkDominican RepublicEarly-demographic dividendEast Asia & PacificEast Asia & Pacific (excluding high income)East Asia & Pacific (IDA & IBRD countries)EcuadorEgypt, Arab Rep.El SalvadorEritreaEstoniaEthiopiaEuro areaEurope & Central AsiaEurope & Central Asia (excluding high income)Europe & Central Asia (IDA & IBRD countries)European UnionFinlandFragile and conflict affected situationsFranceGabonGeorgiaGermanyGhanaGibraltarGreeceGuatemalaHaitiHeavily indebted poor countries (HIPC)High incomeHondurasHong Kong SAR, ChinaHungaryIBRD onlyIcelandIDA & IBRD totalIDA blendIDA onlyIDA totalIndiaIndonesiaIran, Islamic Rep.IraqIrelandIsraelItalyJamaicaJapanJordanKazakhstanKenyaKorea, Dem. People’s Rep.Korea, Rep.KosovoKuwaitKyrgyz RepublicLate-demographic dividendLatin America & Caribbean Latin America & Caribbean (excluding high income)Latin America & the Caribbean (IDA & IBRD countries)LatviaLeast developed countries: UN classificationLebanonLibyaLithuaniaLow & middle incomeLow incomeLower middle incomeLuxembourgMacedonia, FYRMalaysiaMaltaMauritiusMexicoMiddle East & North AfricaMiddle East & North Africa (excluding high income)Middle East & North Africa (IDA & IBRD countries)Middle incomeMoldovaMongoliaMontenegroMoroccoMozambiqueMyanmarNamibiaNepalNetherlandsNew ZealandNicaraguaNigerNigeriaNorth AmericaNorwayOECD membersOmanOther small statesPakistanPanamaParaguayPeruPhilippinesPolandPortugalPost-demographic dividendPre-demographic dividendQatarRomaniaRussian FederationSaudi ArabiaSenegalSerbiaSingaporeSlovak RepublicSloveniaSmall statesSouth AfricaSouth AsiaSouth Asia (IDA & IBRD)South SudanSpainSri LankaSub-Saharan Africa Sub-Saharan Africa (excluding high income)Sub-Saharan Africa (IDA & IBRD countries)SudanSwedenSwitzerlandSyrian Arab RepublicTajikistanTanzaniaThailandTogoTrinidad and TobagoTunisiaTurkeyTurkmenistanUkraineUnited Arab EmiratesUnited KingdomUnited StatesUpper middle incomeUruguayUzbekistanVenezuela, RBVietnamWorldYemen, Rep.ZambiaZimbabwe Timeline:
This timeline shows a graph from 1972 to 2014 of South Asia (IDA & IBRD). No data until 1971. Number of actual observations by date: 43.
Source name:
World Development Indicators
Source organization:
IEA Statistics © OECD/IEA 2014 (http://www.iea.org/stats/index.asp), subject to https://www.iea.org/t&c/termsandconditions/
Categories, topics:
Energy & Mining
Last updated:
apr 23, 2017
Indicators value changes by year
Minimum:
26.317
jan 1, 2014
Maximum:
64.277
jan 1, 1972
At the date of observation
Value
Absolute change
Change from previous value
jan 1, 1972
64.277
+64.277
0.0%
jan 1, 1973
64.228
-0.049
-0.08%
jan 1, 1974
63.724
-0.505
-0.79%
jan 1, 1975
62.761
-0.963
-1.51%
jan 1, 1976
62.114
-0.647
-1.03%
jan 1, 1977
61.309
-0.806
-1.3%
jan 1, 1978
60.924
-0.385
-0.63%
jan 1, 1979
61.273
+0.349
0.57%
jan 1, 1980
59.923
-1.35
-2.2%
jan 1, 1981
59.161
-0.762
-1.27%
jan 1, 1982
57.185
-1.976
-3.34%
jan 1, 1983
55.794
-1.391
-2.43%
jan 1, 1984
54.856
-0.938
-1.68%
jan 1, 1985
53.618
-1.237
-2.26%
jan 1, 1986
51.832
-1.786
-3.33%
jan 1, 1987
50.831
-1.001
-1.93%
jan 1, 1988
49.319
-1.512
-2.97%
jan 1, 1989
47.659
-1.66
-3.37%
jan 1, 1990
46.265
-1.393
-2.92%
jan 1, 1991
45.088
-1.177
-2.55%
jan 1, 1992
44.212
-0.876
-1.94%
jan 1, 1993
43.075
-1.137
-2.57%
jan 1, 1994
42.351
-0.724
-1.68%
jan 1, 1995
41.001
-1.35
-3.19%
jan 1, 1996
39.345
-1.656
-4.04%
jan 1, 1997
38.407
-0.937
-2.38%
jan 1, 1998
37.538
-0.87
-2.26%
jan 1, 1999
36.953
-0.584
-1.56%
jan 1, 2000
35.801
-1.152
-3.12%
jan 1, 2001
35.53
-0.271
-0.76%
jan 1, 2002
35.36
-0.17
-0.48%
jan 1, 2003
34.988
-0.371
-1.05%
jan 1, 2004
34.633
-0.355
-1.01%
jan 1, 2005
33.43
-1.203
-3.47%
jan 1, 2006
32.749
-0.681
-2.04%
jan 1, 2007
31.727
-1.022
-3.12%
jan 1, 2008
30.715
-1.012
-3.19%
jan 1, 2009
30.144
-0.571
-1.86%
jan 1, 2010
28.228
-1.915
-6.35%
jan 1, 2011
27.596
-0.632
-2.24%
jan 1, 2012
27.293
-0.303
-1.1%
jan 1, 2013
26.621
-0.672
-2.46%
jan 1, 2014
26.317
-0.304
-1.14%
Ranking of countries by current statistics by years


Comments: