29
/
en
AIzaSyAYiBZKx7MnpbEhh9jyipgxe19OcubqV5w
April 1, 2024
256142
Sweden
SWE
true
2
1
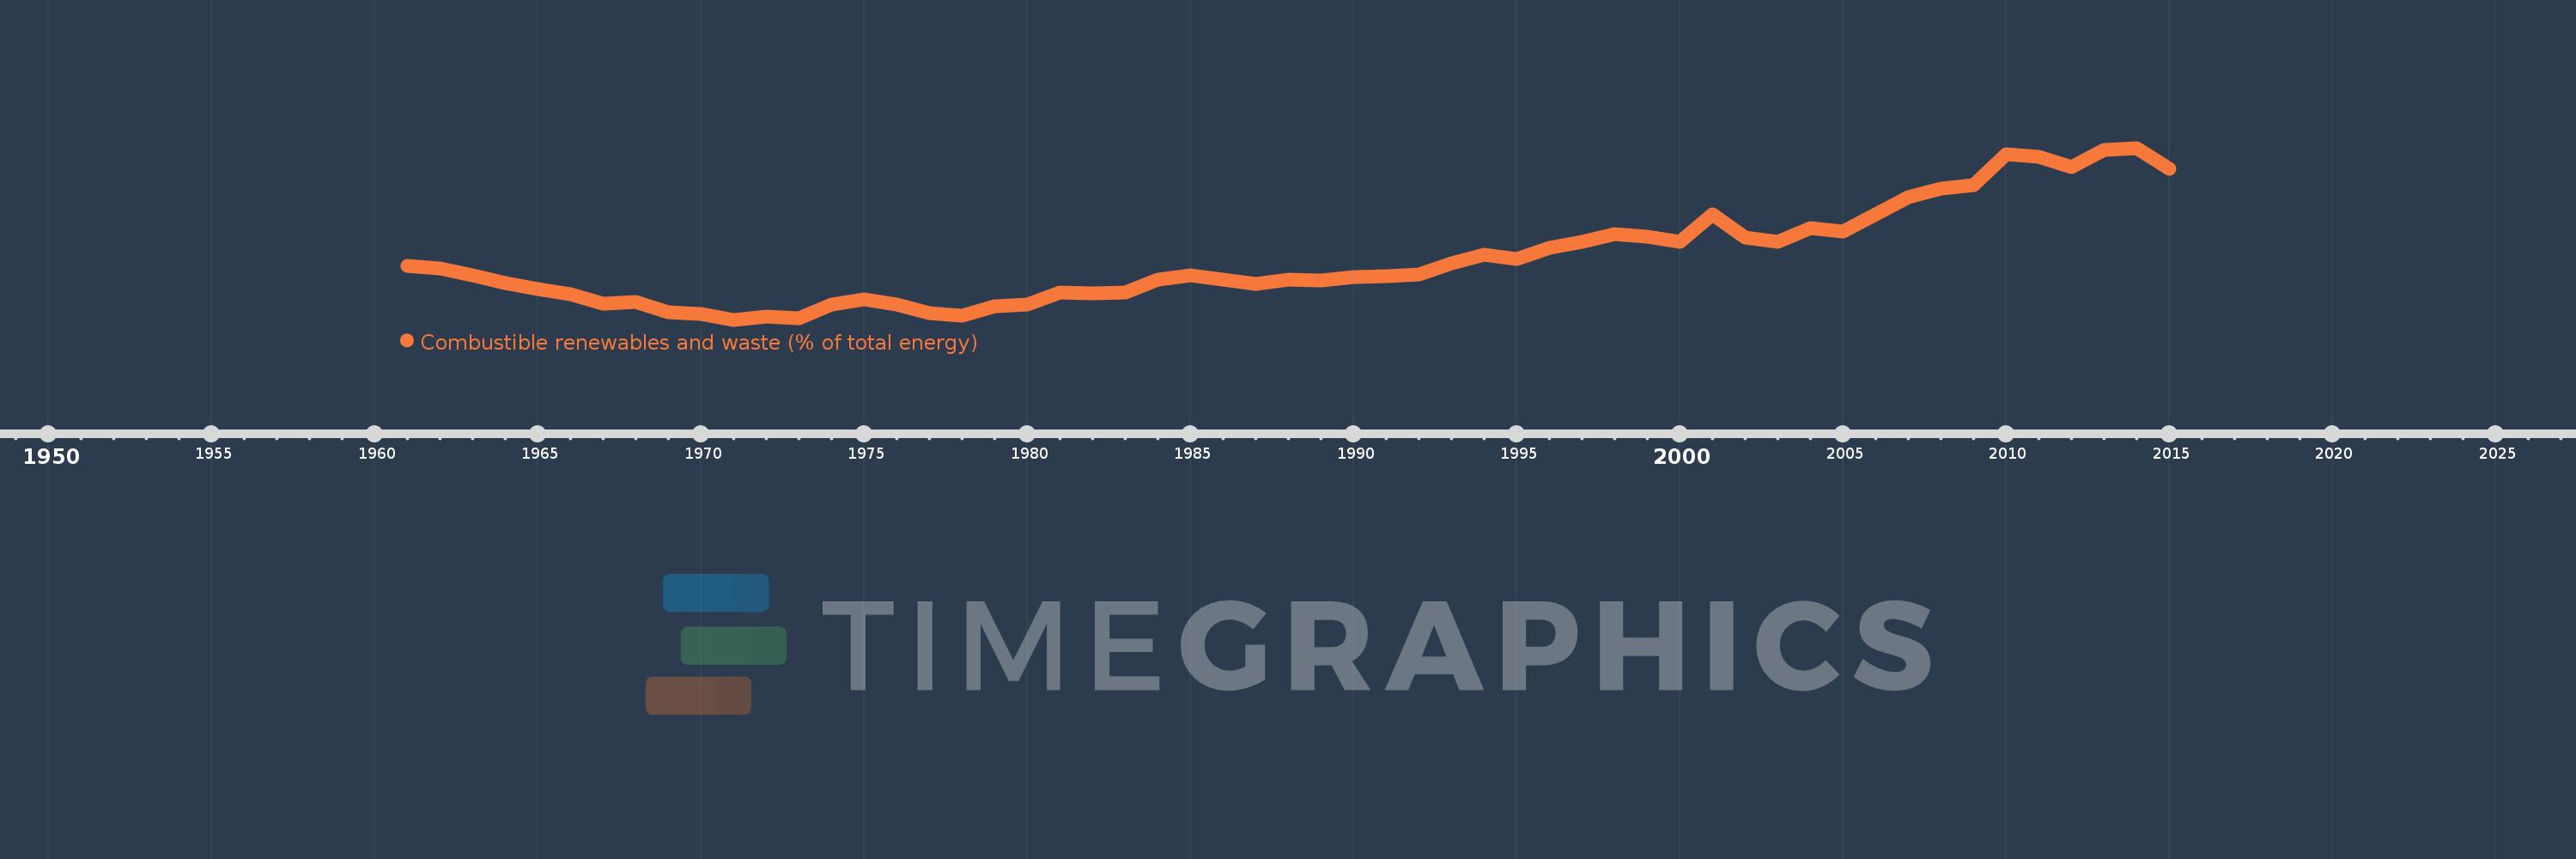
Combustible renewables and waste (% of total energy)
2015,2014,2013,2012,2011,2010,2009,2008,2007,2006,2005,2004,2003,2002,2001,2000,1999,1998,1997,1996,1995,1994,1993,1992,1991,1990,1989,1988,1987,1986,1985,1984,1983,1982,1981,1980,1979,1978,1977,1976,1975,1974,1973,1972,1971,1970,1969,1968,1967,1966,1965,1964,1963,1962,1961
This statistics in other country:
AlbaniaAlgeriaAngolaArab WorldArgentinaArmeniaAustraliaAustriaAzerbaijanBahrainBangladeshBelarusBelgiumBeninBoliviaBosnia and HerzegovinaBotswanaBrazilBrunei DarussalamBulgariaCambodiaCameroonCanadaCaribbean small statesCentral Europe and the BalticsChileChinaColombiaCongo, Dem. Rep.Congo, Rep.Costa RicaCote d'IvoireCroatiaCubaCuracaoCyprusCzech RepublicDenmarkDominican RepublicEarly-demographic dividendEast Asia & PacificEast Asia & Pacific (excluding high income)East Asia & Pacific (IDA & IBRD countries)EcuadorEgypt, Arab Rep.El SalvadorEritreaEstoniaEthiopiaEuro areaEurope & Central AsiaEurope & Central Asia (excluding high income)Europe & Central Asia (IDA & IBRD countries)European UnionFinlandFragile and conflict affected situationsFranceGabonGeorgiaGermanyGhanaGibraltarGreeceGuatemalaHaitiHeavily indebted poor countries (HIPC)High incomeHondurasHong Kong SAR, ChinaHungaryIBRD onlyIcelandIDA & IBRD totalIDA blendIDA onlyIDA totalIndiaIndonesiaIran, Islamic Rep.IraqIrelandIsraelItalyJamaicaJapanJordanKazakhstanKenyaKorea, Dem. People’s Rep.Korea, Rep.KosovoKuwaitKyrgyz RepublicLate-demographic dividendLatin America & Caribbean Latin America & Caribbean (excluding high income)Latin America & the Caribbean (IDA & IBRD countries)LatviaLeast developed countries: UN classificationLebanonLibyaLithuaniaLow & middle incomeLow incomeLower middle incomeLuxembourgMacedonia, FYRMalaysiaMaltaMauritiusMexicoMiddle East & North AfricaMiddle East & North Africa (excluding high income)Middle East & North Africa (IDA & IBRD countries)Middle incomeMoldovaMongoliaMontenegroMoroccoMozambiqueMyanmarNamibiaNepalNetherlandsNew ZealandNicaraguaNigerNigeriaNorth AmericaNorwayOECD membersOmanOther small statesPakistanPanamaParaguayPeruPhilippinesPolandPortugalPost-demographic dividendPre-demographic dividendQatarRomaniaRussian FederationSaudi ArabiaSenegalSerbiaSingaporeSlovak RepublicSloveniaSmall statesSouth AfricaSouth AsiaSouth Asia (IDA & IBRD)South SudanSpainSri LankaSub-Saharan Africa Sub-Saharan Africa (excluding high income)Sub-Saharan Africa (IDA & IBRD countries)SudanSwedenSwitzerlandSyrian Arab RepublicTajikistanTanzaniaThailandTogoTrinidad and TobagoTunisiaTurkeyTurkmenistanUkraineUnited Arab EmiratesUnited KingdomUnited StatesUpper middle incomeUruguayUzbekistanVenezuela, RBVietnamWorldYemen, Rep.ZambiaZimbabwe Timeline:
This timeline shows a graph from 1961 to 2015 of Sweden. No data until 1960. Number of actual observations by date: 55.
Source name:
World Development Indicators
Source organization:
IEA Statistics © OECD/IEA 2014 (http://www.iea.org/stats/index.asp), subject to https://www.iea.org/t&c/termsandconditions/
Categories, topics:
Energy & Mining
Last updated:
apr 23, 2017
Indicators value changes by year
Maximum:
23.402
jan 1, 2014
At the date of observation
Value
Absolute change
Change from previous value
jan 1, 1961
12.622
+12.622
0.0%
jan 1, 1962
12.412
-0.209
-1.66%
jan 1, 1963
11.815
-0.597
-4.81%
jan 1, 1964
11.097
-0.718
-6.07%
jan 1, 1965
10.564
-0.533
-4.8%
jan 1, 1966
10.041
-0.523
-4.95%
jan 1, 1967
9.225
-0.816
-8.12%
jan 1, 1968
9.346
+0.121
1.31%
jan 1, 1969
8.433
-0.913
-9.77%
jan 1, 1970
8.281
-0.152
-1.8%
jan 1, 1971
7.727
-0.554
-6.69%
jan 1, 1972
8.017
+0.29
3.75%
jan 1, 1973
7.858
-0.159
-1.99%
jan 1, 1974
9.125
+1.267
16.13%
jan 1, 1975
9.616
+0.491
5.38%
jan 1, 1976
9.137
-0.48
-4.99%
jan 1, 1977
8.309
-0.828
-9.06%
jan 1, 1978
8.116
-0.193
-2.32%
jan 1, 1979
8.943
+0.827
10.19%
jan 1, 1980
9.089
+0.146
1.63%
jan 1, 1981
10.203
+1.113
12.25%
jan 1, 1982
10.098
-0.105
-1.03%
jan 1, 1983
10.221
+0.123
1.22%
jan 1, 1984
11.357
+1.137
11.12%
jan 1, 1985
11.76
+0.403
3.55%
jan 1, 1986
11.403
-0.357
-3.04%
jan 1, 1987
11.013
-0.389
-3.41%
jan 1, 1988
11.36
+0.347
3.15%
jan 1, 1989
11.332
-0.028
-0.25%
jan 1, 1990
11.604
+0.272
2.4%
jan 1, 1991
11.666
+0.062
0.53%
jan 1, 1992
11.834
+0.168
1.44%
jan 1, 1993
12.859
+1.024
8.66%
jan 1, 1994
13.663
+0.805
6.26%
jan 1, 1995
13.243
-0.42
-3.08%
jan 1, 1996
14.314
+1.071
8.09%
jan 1, 1997
14.813
+0.498
3.48%
jan 1, 1998
15.578
+0.766
5.17%
jan 1, 1999
15.267
-0.312
-2.0%
jan 1, 2000
14.826
-0.441
-2.89%
jan 1, 2001
17.374
+2.548
17.18%
jan 1, 2002
15.258
-2.116
-12.18%
jan 1, 2003
14.866
-0.392
-2.57%
jan 1, 2004
16.062
+1.196
8.05%
jan 1, 2005
15.787
-0.275
-1.71%
jan 1, 2006
17.374
+1.587
10.05%
jan 1, 2007
18.935
+1.561
8.98%
jan 1, 2008
19.72
+0.785
4.15%
jan 1, 2009
20.024
+0.304
1.54%
jan 1, 2010
22.864
+2.841
14.19%
jan 1, 2011
22.569
-0.296
-1.29%
jan 1, 2012
21.692
-0.877
-3.89%
jan 1, 2013
23.225
+1.533
7.07%
jan 1, 2014
23.402
+0.177
0.76%
jan 1, 2015
21.483
-1.918
-8.2%
Ranking of countries by current statistics by years


Comments: