29
/
en
AIzaSyAYiBZKx7MnpbEhh9jyipgxe19OcubqV5w
April 1, 2024
44900
Low & middle income
LMY
false
2
1
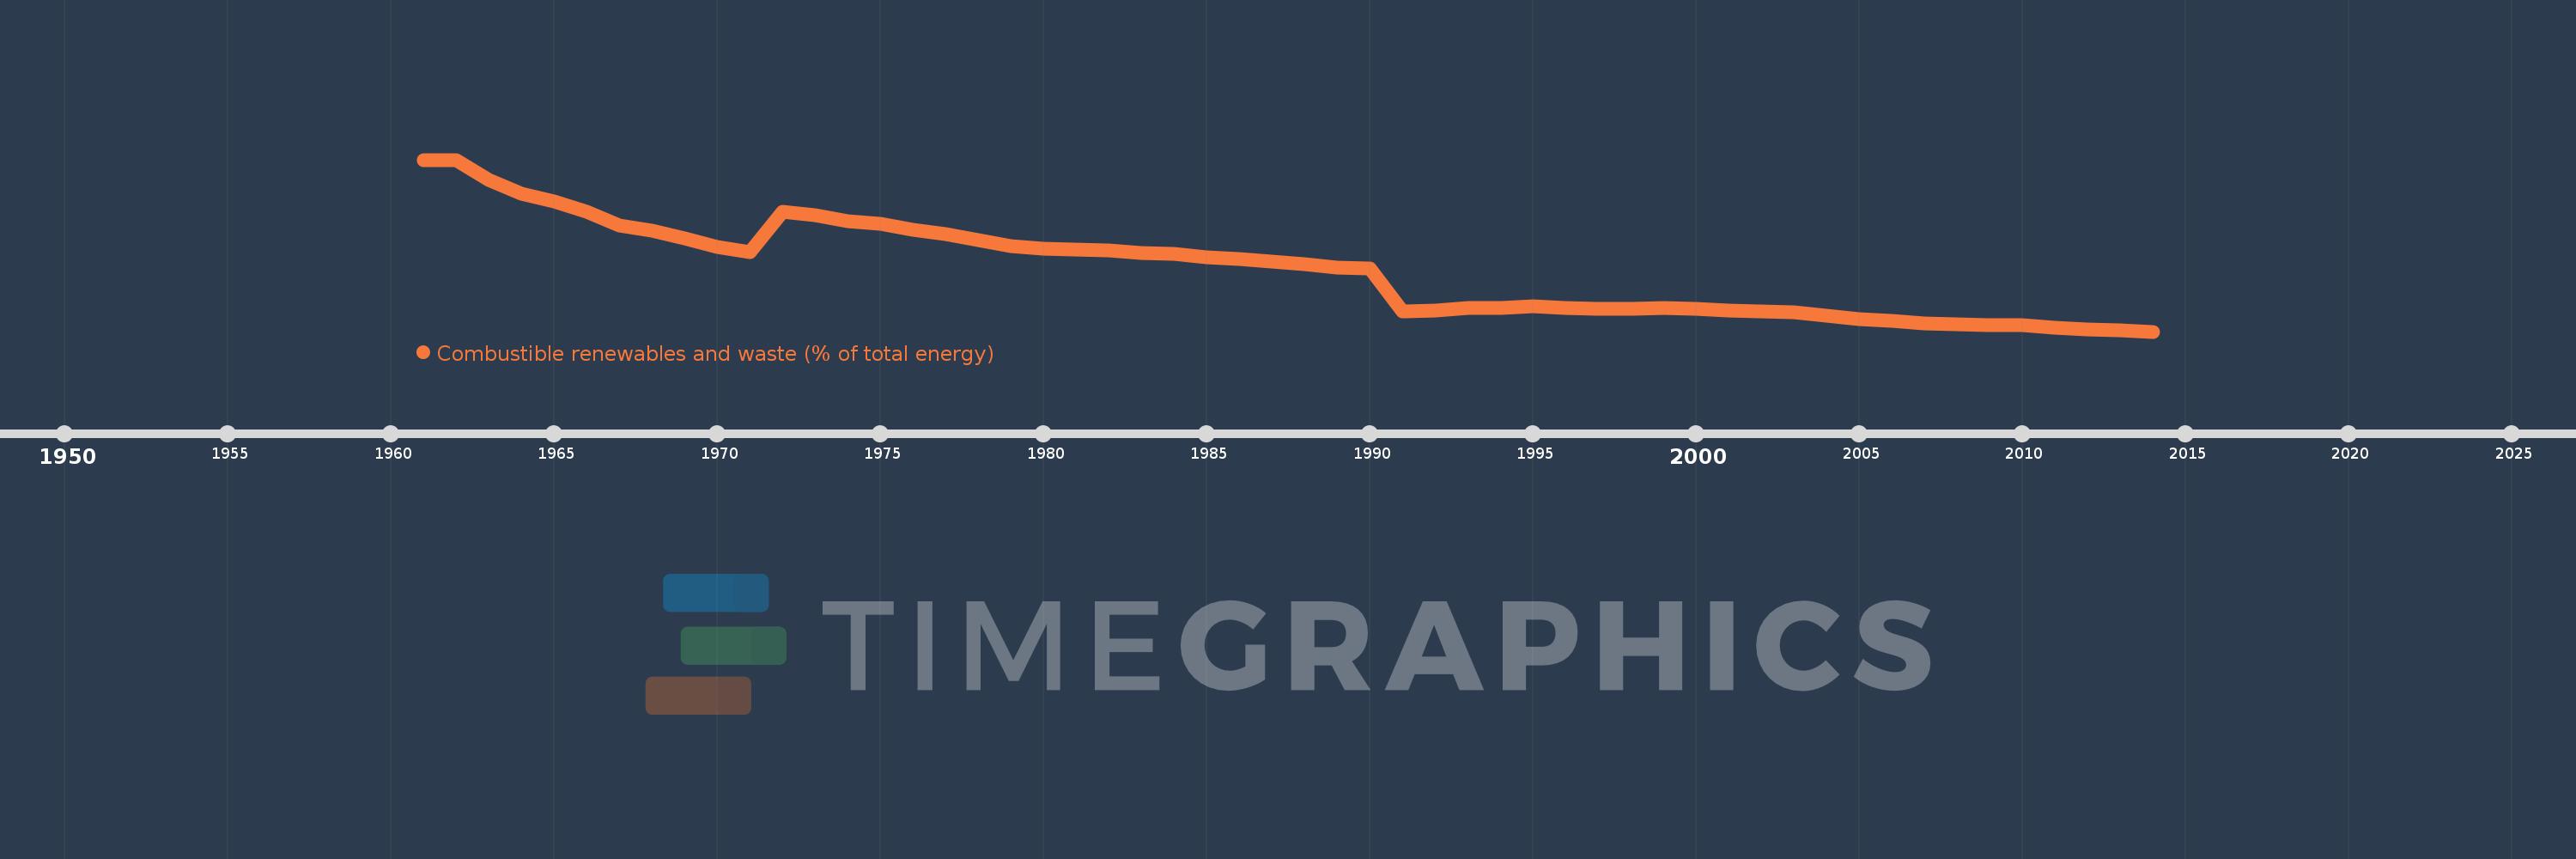
Combustible renewables and waste (% of total energy)
2014,2013,2012,2011,2010,2009,2008,2007,2006,2005,2004,2003,2002,2001,2000,1999,1998,1997,1996,1995,1994,1993,1992,1991,1990,1989,1988,1987,1986,1985,1984,1983,1982,1981,1980,1979,1978,1977,1976,1975,1974,1973,1972,1971,1970,1969,1968,1967,1966,1965,1964,1963,1962,1961
This statistics in other country:
AlbaniaAlgeriaAngolaArab WorldArgentinaArmeniaAustraliaAustriaAzerbaijanBahrainBangladeshBelarusBelgiumBeninBoliviaBosnia and HerzegovinaBotswanaBrazilBrunei DarussalamBulgariaCambodiaCameroonCanadaCaribbean small statesCentral Europe and the BalticsChileChinaColombiaCongo, Dem. Rep.Congo, Rep.Costa RicaCote d'IvoireCroatiaCubaCuracaoCyprusCzech RepublicDenmarkDominican RepublicEarly-demographic dividendEast Asia & PacificEast Asia & Pacific (excluding high income)East Asia & Pacific (IDA & IBRD countries)EcuadorEgypt, Arab Rep.El SalvadorEritreaEstoniaEthiopiaEuro areaEurope & Central AsiaEurope & Central Asia (excluding high income)Europe & Central Asia (IDA & IBRD countries)European UnionFinlandFragile and conflict affected situationsFranceGabonGeorgiaGermanyGhanaGibraltarGreeceGuatemalaHaitiHeavily indebted poor countries (HIPC)High incomeHondurasHong Kong SAR, ChinaHungaryIBRD onlyIcelandIDA & IBRD totalIDA blendIDA onlyIDA totalIndiaIndonesiaIran, Islamic Rep.IraqIrelandIsraelItalyJamaicaJapanJordanKazakhstanKenyaKorea, Dem. People’s Rep.Korea, Rep.KosovoKuwaitKyrgyz RepublicLate-demographic dividendLatin America & Caribbean Latin America & Caribbean (excluding high income)Latin America & the Caribbean (IDA & IBRD countries)LatviaLeast developed countries: UN classificationLebanonLibyaLithuaniaLow & middle incomeLow incomeLower middle incomeLuxembourgMacedonia, FYRMalaysiaMaltaMauritiusMexicoMiddle East & North AfricaMiddle East & North Africa (excluding high income)Middle East & North Africa (IDA & IBRD countries)Middle incomeMoldovaMongoliaMontenegroMoroccoMozambiqueMyanmarNamibiaNepalNetherlandsNew ZealandNicaraguaNigerNigeriaNorth AmericaNorwayOECD membersOmanOther small statesPakistanPanamaParaguayPeruPhilippinesPolandPortugalPost-demographic dividendPre-demographic dividendQatarRomaniaRussian FederationSaudi ArabiaSenegalSerbiaSingaporeSlovak RepublicSloveniaSmall statesSouth AfricaSouth AsiaSouth Asia (IDA & IBRD)South SudanSpainSri LankaSub-Saharan Africa Sub-Saharan Africa (excluding high income)Sub-Saharan Africa (IDA & IBRD countries)SudanSwedenSwitzerlandSyrian Arab RepublicTajikistanTanzaniaThailandTogoTrinidad and TobagoTunisiaTurkeyTurkmenistanUkraineUnited Arab EmiratesUnited KingdomUnited StatesUpper middle incomeUruguayUzbekistanVenezuela, RBVietnamWorldYemen, Rep.ZambiaZimbabwe Timeline:
This timeline shows a graph from 1961 to 2014 of Low & middle income. No data until 1960. Number of actual observations by date: 54.
Source name:
World Development Indicators
Source organization:
IEA Statistics © OECD/IEA 2014 (http://www.iea.org/stats/index.asp), subject to https://www.iea.org/t&c/termsandconditions/
Categories, topics:
Energy & Mining
Last updated:
apr 23, 2017
Indicators value changes by year
Minimum:
13.635
jan 1, 2014
Maximum:
54.995
jan 1, 1961
At the date of observation
Value
Absolute change
Change from previous value
jan 1, 1961
54.995
+54.995
0.0%
jan 1, 1962
54.838
-0.157
-0.28%
jan 1, 1963
50.135
-4.703
-8.58%
jan 1, 1964
46.893
-3.242
-6.47%
jan 1, 1965
44.919
-1.974
-4.21%
jan 1, 1966
42.509
-2.41
-5.37%
jan 1, 1967
39.178
-3.331
-7.84%
jan 1, 1968
38.026
-1.152
-2.94%
jan 1, 1969
36.113
-1.913
-5.03%
jan 1, 1970
34.089
-2.024
-5.6%
jan 1, 1971
32.79
-1.299
-3.81%
jan 1, 1972
42.46
+9.67
29.49%
jan 1, 1973
41.603
-0.857
-2.02%
jan 1, 1974
40.284
-1.32
-3.17%
jan 1, 1975
39.615
-0.669
-1.66%
jan 1, 1976
38.125
-1.489
-3.76%
jan 1, 1977
37.086
-1.04
-2.73%
jan 1, 1978
35.56
-1.525
-4.11%
jan 1, 1979
34.181
-1.379
-3.88%
jan 1, 1980
33.64
-0.542
-1.58%
jan 1, 1981
33.335
-0.305
-0.91%
jan 1, 1982
33.198
-0.137
-0.41%
jan 1, 1983
32.549
-0.649
-1.95%
jan 1, 1984
32.304
-0.246
-0.75%
jan 1, 1985
31.611
-0.692
-2.14%
jan 1, 1986
31.139
-0.472
-1.49%
jan 1, 1987
30.534
-0.605
-1.94%
jan 1, 1988
29.818
-0.716
-2.34%
jan 1, 1989
29.12
-0.699
-2.34%
jan 1, 1990
28.843
-0.277
-0.95%
jan 1, 1991
18.526
-10.316
-35.77%
jan 1, 1992
18.762
+0.236
1.27%
jan 1, 1993
19.338
+0.576
3.07%
jan 1, 1994
19.379
+0.041
0.21%
jan 1, 1995
19.717
+0.338
1.74%
jan 1, 1996
19.359
-0.358
-1.82%
jan 1, 1997
19.202
-0.157
-0.81%
jan 1, 1998
19.218
+0.016
0.09%
jan 1, 1999
19.297
+0.079
0.41%
jan 1, 2000
19.151
-0.146
-0.76%
jan 1, 2001
18.711
-0.44
-2.3%
jan 1, 2002
18.522
-0.189
-1.01%
jan 1, 2003
18.279
-0.243
-1.31%
jan 1, 2004
17.52
-0.759
-4.15%
jan 1, 2005
16.621
-0.899
-5.13%
jan 1, 2006
16.175
-0.446
-2.69%
jan 1, 2007
15.659
-0.515
-3.19%
jan 1, 2008
15.418
-0.241
-1.54%
jan 1, 2009
15.258
-0.161
-1.04%
jan 1, 2010
15.108
-0.149
-0.98%
jan 1, 2011
14.589
-0.52
-3.44%
jan 1, 2012
14.153
-0.436
-2.99%
jan 1, 2013
13.879
-0.274
-1.94%
jan 1, 2014
13.635
-0.244
-1.76%
Ranking of countries by current statistics by years


Comments: