29
/
en
AIzaSyAYiBZKx7MnpbEhh9jyipgxe19OcubqV5w
April 1, 2024
158295
Iraq
IRQ
true
2
1
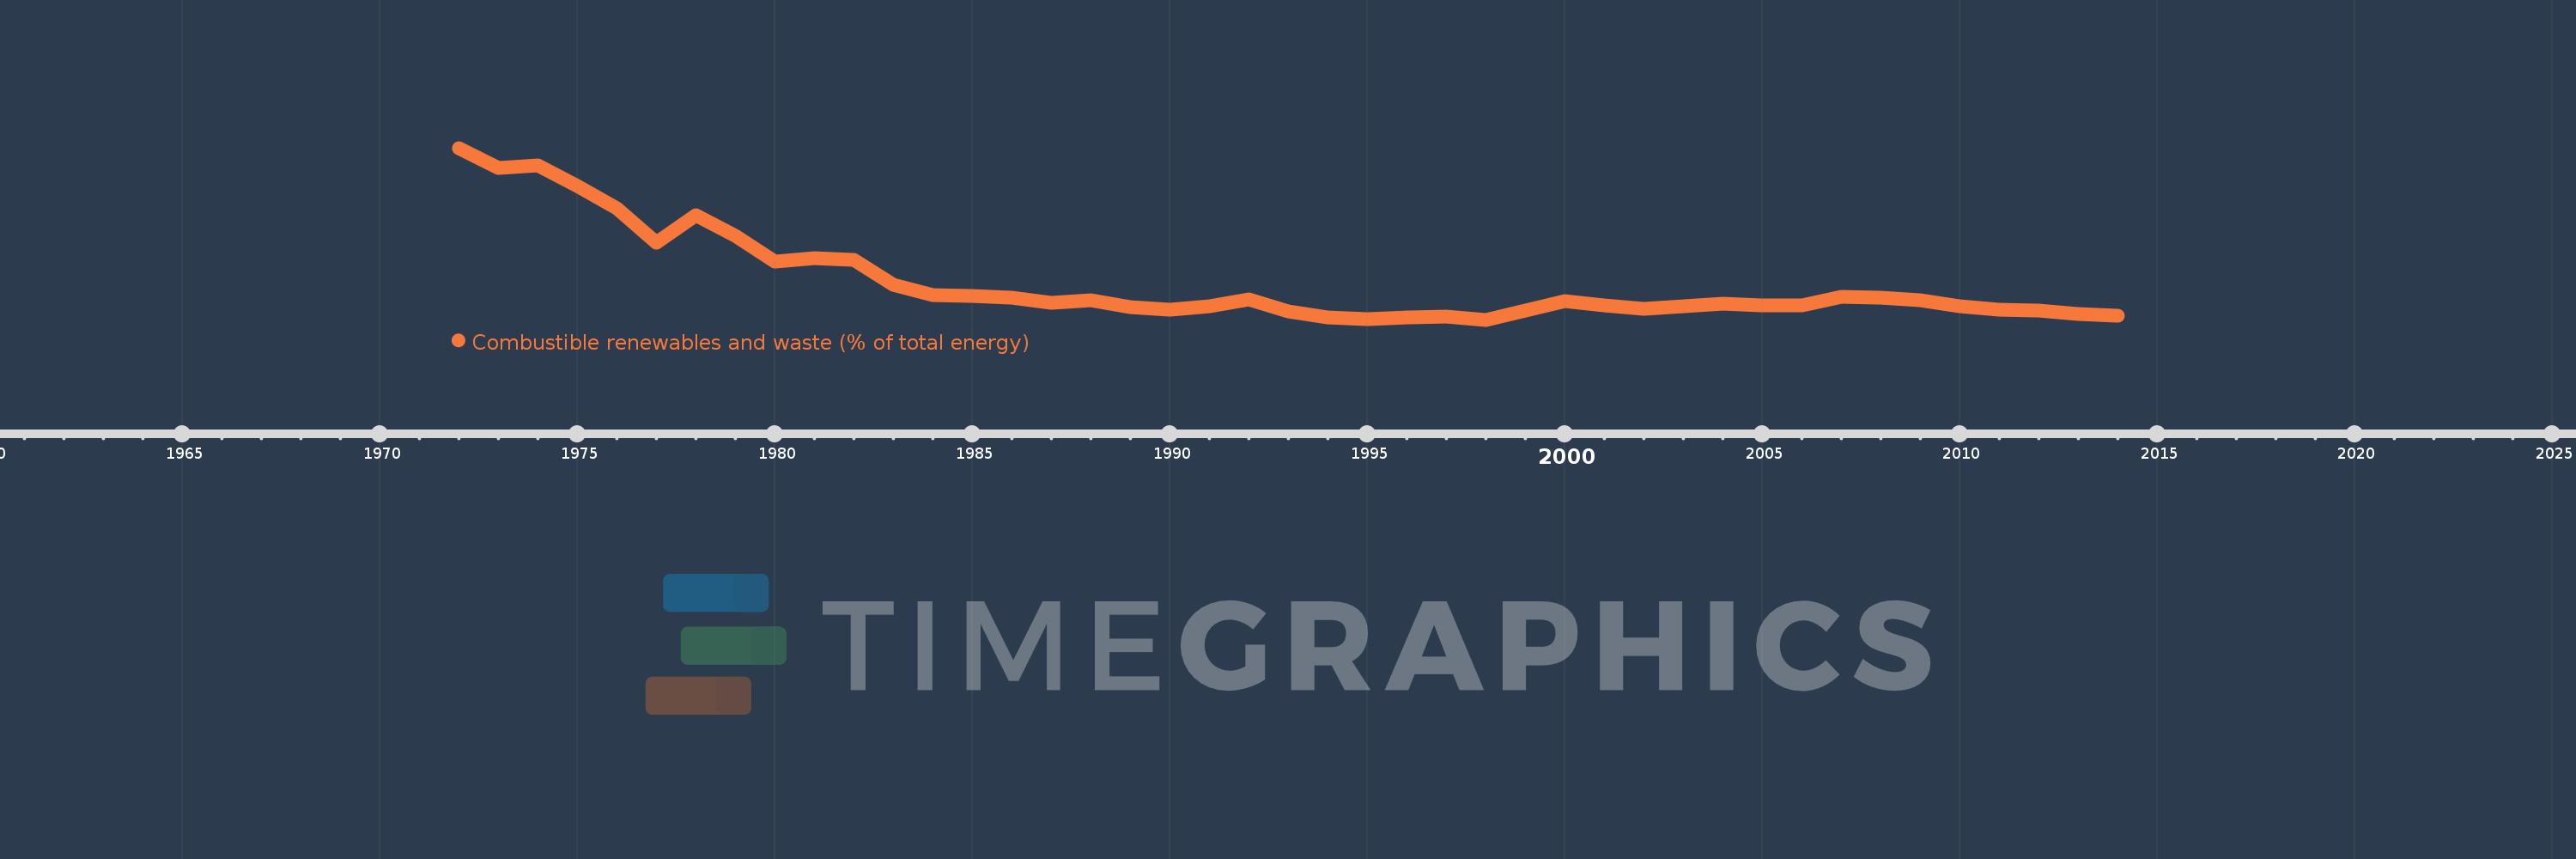
Combustible renewables and waste (% of total energy)
2014,2013,2012,2011,2010,2009,2008,2007,2006,2005,2004,2003,2002,2001,2000,1999,1998,1997,1996,1995,1994,1993,1992,1991,1990,1989,1988,1987,1986,1985,1984,1983,1982,1981,1980,1979,1978,1977,1976,1975,1974,1973,1972
This statistics in other country:
AlbaniaAlgeriaAngolaArab WorldArgentinaArmeniaAustraliaAustriaAzerbaijanBahrainBangladeshBelarusBelgiumBeninBoliviaBosnia and HerzegovinaBotswanaBrazilBrunei DarussalamBulgariaCambodiaCameroonCanadaCaribbean small statesCentral Europe and the BalticsChileChinaColombiaCongo, Dem. Rep.Congo, Rep.Costa RicaCote d'IvoireCroatiaCubaCuracaoCyprusCzech RepublicDenmarkDominican RepublicEarly-demographic dividendEast Asia & PacificEast Asia & Pacific (excluding high income)East Asia & Pacific (IDA & IBRD countries)EcuadorEgypt, Arab Rep.El SalvadorEritreaEstoniaEthiopiaEuro areaEurope & Central AsiaEurope & Central Asia (excluding high income)Europe & Central Asia (IDA & IBRD countries)European UnionFinlandFragile and conflict affected situationsFranceGabonGeorgiaGermanyGhanaGibraltarGreeceGuatemalaHaitiHeavily indebted poor countries (HIPC)High incomeHondurasHong Kong SAR, ChinaHungaryIBRD onlyIcelandIDA & IBRD totalIDA blendIDA onlyIDA totalIndiaIndonesiaIran, Islamic Rep.IraqIrelandIsraelItalyJamaicaJapanJordanKazakhstanKenyaKorea, Dem. People’s Rep.Korea, Rep.KosovoKuwaitKyrgyz RepublicLate-demographic dividendLatin America & Caribbean Latin America & Caribbean (excluding high income)Latin America & the Caribbean (IDA & IBRD countries)LatviaLeast developed countries: UN classificationLebanonLibyaLithuaniaLow & middle incomeLow incomeLower middle incomeLuxembourgMacedonia, FYRMalaysiaMaltaMauritiusMexicoMiddle East & North AfricaMiddle East & North Africa (excluding high income)Middle East & North Africa (IDA & IBRD countries)Middle incomeMoldovaMongoliaMontenegroMoroccoMozambiqueMyanmarNamibiaNepalNetherlandsNew ZealandNicaraguaNigerNigeriaNorth AmericaNorwayOECD membersOmanOther small statesPakistanPanamaParaguayPeruPhilippinesPolandPortugalPost-demographic dividendPre-demographic dividendQatarRomaniaRussian FederationSaudi ArabiaSenegalSerbiaSingaporeSlovak RepublicSloveniaSmall statesSouth AfricaSouth AsiaSouth Asia (IDA & IBRD)South SudanSpainSri LankaSub-Saharan Africa Sub-Saharan Africa (excluding high income)Sub-Saharan Africa (IDA & IBRD countries)SudanSwedenSwitzerlandSyrian Arab RepublicTajikistanTanzaniaThailandTogoTrinidad and TobagoTunisiaTurkeyTurkmenistanUkraineUnited Arab EmiratesUnited KingdomUnited StatesUpper middle incomeUruguayUzbekistanVenezuela, RBVietnamWorldYemen, Rep.ZambiaZimbabwe Timeline:
This timeline shows a graph from 1972 to 2014 of Iraq. No data until 1971. Number of actual observations by date: 43.
Source name:
World Development Indicators
Source organization:
IEA Statistics © OECD/IEA 2014 (http://www.iea.org/stats/index.asp), subject to https://www.iea.org/t&c/termsandconditions/
Categories, topics:
Energy & Mining
Last updated:
apr 23, 2017
Indicators value changes by year
At the date of observation
Value
Absolute change
Change from previous value
jan 1, 1972
0.663
+0.663
0.0%
jan 1, 1973
0.595
-0.068
-10.27%
jan 1, 1974
0.603
+0.008
1.3%
jan 1, 1975
0.533
-0.069
-11.48%
jan 1, 1976
0.454
-0.079
-14.84%
jan 1, 1977
0.336
-0.119
-26.14%
jan 1, 1978
0.431
+0.095
28.29%
jan 1, 1979
0.359
-0.071
-16.59%
jan 1, 1980
0.271
-0.088
-24.5%
jan 1, 1981
0.283
+0.012
4.32%
jan 1, 1982
0.277
-0.006
-2.1%
jan 1, 1983
0.19
-0.087
-31.56%
jan 1, 1984
0.157
-0.032
-17.07%
jan 1, 1985
0.154
-0.003
-1.94%
jan 1, 1986
0.147
-0.007
-4.68%
jan 1, 1987
0.13
-0.017
-11.81%
jan 1, 1988
0.139
+0.009
7.21%
jan 1, 1989
0.115
-0.024
-17.52%
jan 1, 1990
0.105
-0.01
-8.4%
jan 1, 1991
0.117
+0.012
11.63%
jan 1, 1992
0.141
+0.024
20.11%
jan 1, 1993
0.101
-0.04
-28.08%
jan 1, 1994
0.079
-0.022
-21.52%
jan 1, 1995
0.072
-0.008
-9.68%
jan 1, 1996
0.078
+0.007
9.36%
jan 1, 1997
0.082
+0.003
4.07%
jan 1, 1998
0.071
-0.011
-13.39%
jan 1, 1999
0.102
+0.031
44.21%
jan 1, 2000
0.136
+0.034
33.05%
jan 1, 2001
0.119
-0.017
-12.35%
jan 1, 2002
0.109
-0.009
-7.91%
jan 1, 2003
0.116
+0.007
6.09%
jan 1, 2004
0.125
+0.009
7.96%
jan 1, 2005
0.119
-0.007
-5.26%
jan 1, 2006
0.121
+0.002
2.05%
jan 1, 2007
0.149
+0.027
22.63%
jan 1, 2008
0.146
-0.003
-1.83%
jan 1, 2009
0.138
-0.008
-5.67%
jan 1, 2010
0.118
-0.02
-14.62%
jan 1, 2011
0.106
-0.012
-10.15%
jan 1, 2012
0.102
-0.004
-3.6%
jan 1, 2013
0.092
-0.009
-9.27%
jan 1, 2014
0.085
-0.007
-8.05%
Ranking of countries by current statistics by years


Comments: