29
/
en
AIzaSyAYiBZKx7MnpbEhh9jyipgxe19OcubqV5w
April 1, 2024
193989
Mauritius
MUS
true
2
1
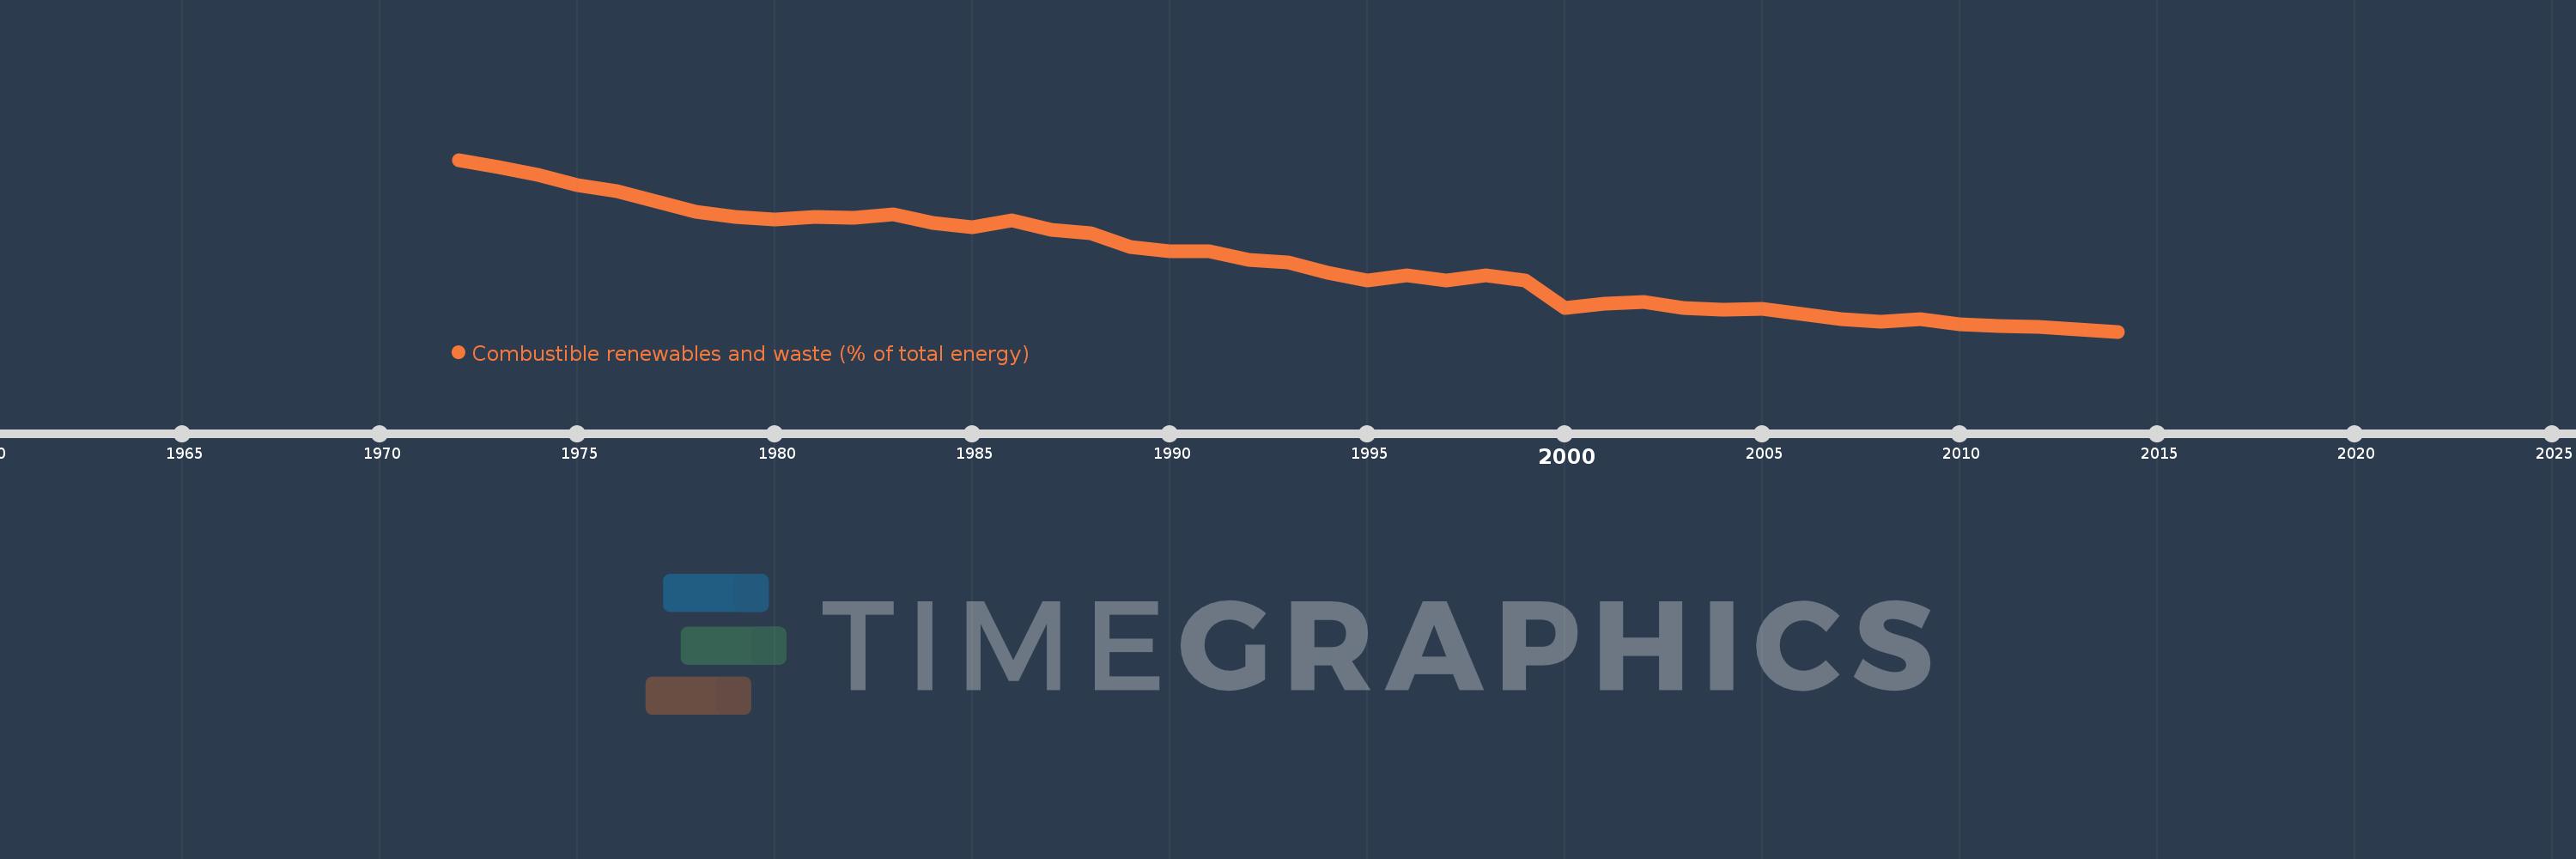
Combustible renewables and waste (% of total energy)
2014,2013,2012,2011,2010,2009,2008,2007,2006,2005,2004,2003,2002,2001,2000,1999,1998,1997,1996,1995,1994,1993,1992,1991,1990,1989,1988,1987,1986,1985,1984,1983,1982,1981,1980,1979,1978,1977,1976,1975,1974,1973,1972
This statistics in other country:
AlbaniaAlgeriaAngolaArab WorldArgentinaArmeniaAustraliaAustriaAzerbaijanBahrainBangladeshBelarusBelgiumBeninBoliviaBosnia and HerzegovinaBotswanaBrazilBrunei DarussalamBulgariaCambodiaCameroonCanadaCaribbean small statesCentral Europe and the BalticsChileChinaColombiaCongo, Dem. Rep.Congo, Rep.Costa RicaCote d'IvoireCroatiaCubaCuracaoCyprusCzech RepublicDenmarkDominican RepublicEarly-demographic dividendEast Asia & PacificEast Asia & Pacific (excluding high income)East Asia & Pacific (IDA & IBRD countries)EcuadorEgypt, Arab Rep.El SalvadorEritreaEstoniaEthiopiaEuro areaEurope & Central AsiaEurope & Central Asia (excluding high income)Europe & Central Asia (IDA & IBRD countries)European UnionFinlandFragile and conflict affected situationsFranceGabonGeorgiaGermanyGhanaGibraltarGreeceGuatemalaHaitiHeavily indebted poor countries (HIPC)High incomeHondurasHong Kong SAR, ChinaHungaryIBRD onlyIcelandIDA & IBRD totalIDA blendIDA onlyIDA totalIndiaIndonesiaIran, Islamic Rep.IraqIrelandIsraelItalyJamaicaJapanJordanKazakhstanKenyaKorea, Dem. People’s Rep.Korea, Rep.KosovoKuwaitKyrgyz RepublicLate-demographic dividendLatin America & Caribbean Latin America & Caribbean (excluding high income)Latin America & the Caribbean (IDA & IBRD countries)LatviaLeast developed countries: UN classificationLebanonLibyaLithuaniaLow & middle incomeLow incomeLower middle incomeLuxembourgMacedonia, FYRMalaysiaMaltaMauritiusMexicoMiddle East & North AfricaMiddle East & North Africa (excluding high income)Middle East & North Africa (IDA & IBRD countries)Middle incomeMoldovaMongoliaMontenegroMoroccoMozambiqueMyanmarNamibiaNepalNetherlandsNew ZealandNicaraguaNigerNigeriaNorth AmericaNorwayOECD membersOmanOther small statesPakistanPanamaParaguayPeruPhilippinesPolandPortugalPost-demographic dividendPre-demographic dividendQatarRomaniaRussian FederationSaudi ArabiaSenegalSerbiaSingaporeSlovak RepublicSloveniaSmall statesSouth AfricaSouth AsiaSouth Asia (IDA & IBRD)South SudanSpainSri LankaSub-Saharan Africa Sub-Saharan Africa (excluding high income)Sub-Saharan Africa (IDA & IBRD countries)SudanSwedenSwitzerlandSyrian Arab RepublicTajikistanTanzaniaThailandTogoTrinidad and TobagoTunisiaTurkeyTurkmenistanUkraineUnited Arab EmiratesUnited KingdomUnited StatesUpper middle incomeUruguayUzbekistanVenezuela, RBVietnamWorldYemen, Rep.ZambiaZimbabwe Timeline:
This timeline shows a graph from 1972 to 2014 of Mauritius. No data until 1971. Number of actual observations by date: 43.
Source name:
World Development Indicators
Source organization:
IEA Statistics © OECD/IEA 2014 (http://www.iea.org/stats/index.asp), subject to https://www.iea.org/t&c/termsandconditions/
Categories, topics:
Energy & Mining
Last updated:
apr 23, 2017
Indicators value changes by year
Minimum:
15.582
jan 1, 2014
Maximum:
75.414
jan 1, 1972
At the date of observation
Value
Absolute change
Change from previous value
jan 1, 1972
75.414
+75.414
0.0%
jan 1, 1973
72.936
-2.478
-3.29%
jan 1, 1974
70.18
-2.756
-3.78%
jan 1, 1975
66.51
-3.67
-5.23%
jan 1, 1976
64.593
-1.918
-2.88%
jan 1, 1977
61.029
-3.564
-5.52%
jan 1, 1978
57.243
-3.785
-6.2%
jan 1, 1979
55.428
-1.815
-3.17%
jan 1, 1980
54.657
-0.771
-1.39%
jan 1, 1981
55.395
+0.737
1.35%
jan 1, 1982
55.092
-0.302
-0.55%
jan 1, 1983
56.314
+1.222
2.22%
jan 1, 1984
53.569
-2.745
-4.87%
jan 1, 1985
51.844
-1.725
-3.22%
jan 1, 1986
54.27
+2.426
4.68%
jan 1, 1987
50.991
-3.278
-6.04%
jan 1, 1988
49.854
-1.137
-2.23%
jan 1, 1989
45.089
-4.766
-9.56%
jan 1, 1990
43.661
-1.427
-3.17%
jan 1, 1991
43.444
-0.218
-0.5%
jan 1, 1992
40.582
-2.862
-6.59%
jan 1, 1993
39.59
-0.992
-2.45%
jan 1, 1994
36.121
-3.469
-8.76%
jan 1, 1995
33.234
-2.887
-7.99%
jan 1, 1996
35.221
+1.987
5.98%
jan 1, 1997
33.472
-1.748
-4.96%
jan 1, 1998
35.235
+1.763
5.27%
jan 1, 1999
33.471
-1.763
-5.0%
jan 1, 2000
23.915
-9.557
-28.55%
jan 1, 2001
25.32
+1.405
5.87%
jan 1, 2002
25.896
+0.577
2.28%
jan 1, 2003
23.876
-2.02
-7.8%
jan 1, 2004
23.239
-0.638
-2.67%
jan 1, 2005
23.602
+0.363
1.56%
jan 1, 2006
21.75
-1.852
-7.85%
jan 1, 2007
19.963
-1.787
-8.22%
jan 1, 2008
19.096
-0.867
-4.34%
jan 1, 2009
19.884
+0.788
4.13%
jan 1, 2010
18.098
-1.786
-8.98%
jan 1, 2011
17.665
-0.433
-2.39%
jan 1, 2012
17.176
-0.489
-2.77%
jan 1, 2013
16.34
-0.836
-4.87%
jan 1, 2014
15.582
-0.758
-4.64%
Ranking of countries by current statistics by years


Comments: