29
/
en
AIzaSyAYiBZKx7MnpbEhh9jyipgxe19OcubqV5w
April 1, 2024
31392
Europe & Central Asia (excluding high income)
ECA
false
2
1
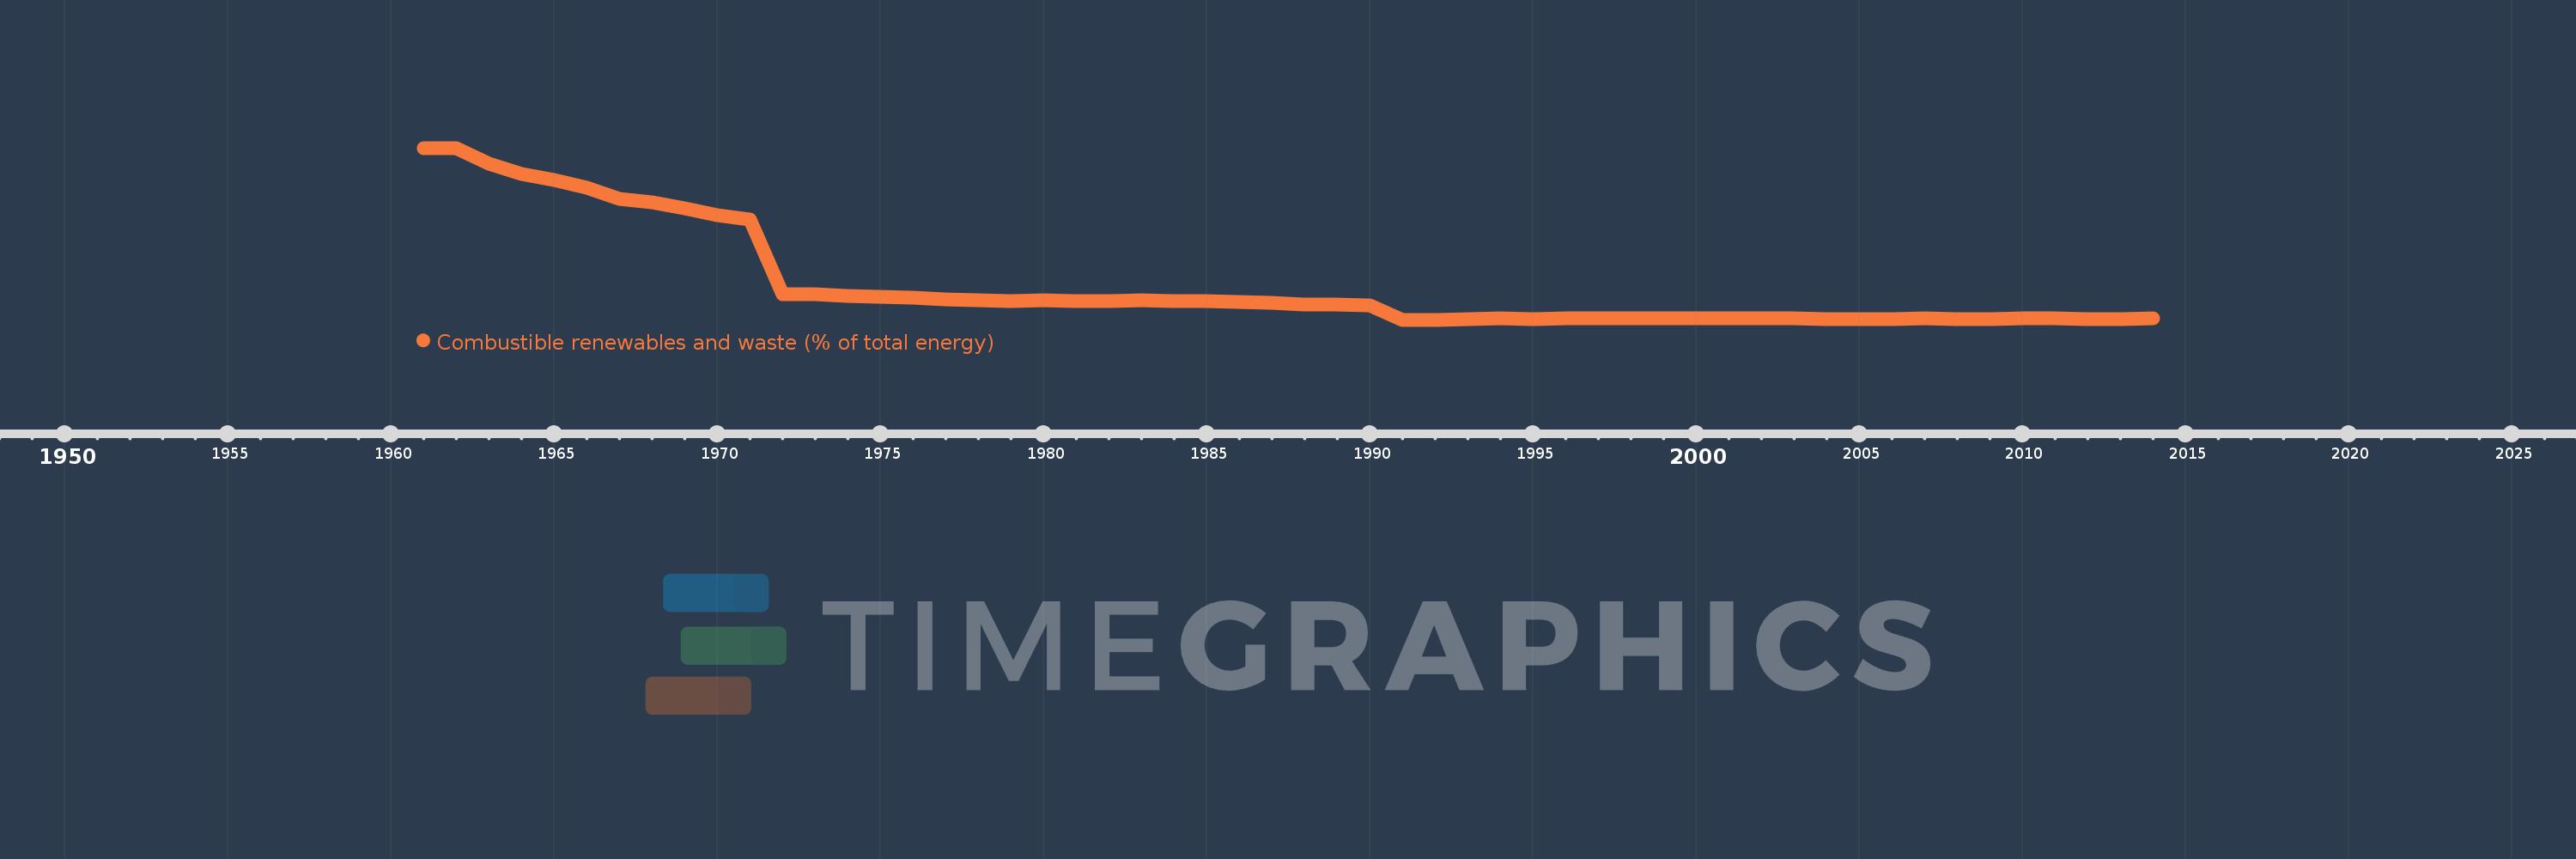
Combustible renewables and waste (% of total energy)
2014,2013,2012,2011,2010,2009,2008,2007,2006,2005,2004,2003,2002,2001,2000,1999,1998,1997,1996,1995,1994,1993,1992,1991,1990,1989,1988,1987,1986,1985,1984,1983,1982,1981,1980,1979,1978,1977,1976,1975,1974,1973,1972,1971,1970,1969,1968,1967,1966,1965,1964,1963,1962,1961
This statistics in other country:
AlbaniaAlgeriaAngolaArab WorldArgentinaArmeniaAustraliaAustriaAzerbaijanBahrainBangladeshBelarusBelgiumBeninBoliviaBosnia and HerzegovinaBotswanaBrazilBrunei DarussalamBulgariaCambodiaCameroonCanadaCaribbean small statesCentral Europe and the BalticsChileChinaColombiaCongo, Dem. Rep.Congo, Rep.Costa RicaCote d'IvoireCroatiaCubaCuracaoCyprusCzech RepublicDenmarkDominican RepublicEarly-demographic dividendEast Asia & PacificEast Asia & Pacific (excluding high income)East Asia & Pacific (IDA & IBRD countries)EcuadorEgypt, Arab Rep.El SalvadorEritreaEstoniaEthiopiaEuro areaEurope & Central AsiaEurope & Central Asia (excluding high income)Europe & Central Asia (IDA & IBRD countries)European UnionFinlandFragile and conflict affected situationsFranceGabonGeorgiaGermanyGhanaGibraltarGreeceGuatemalaHaitiHeavily indebted poor countries (HIPC)High incomeHondurasHong Kong SAR, ChinaHungaryIBRD onlyIcelandIDA & IBRD totalIDA blendIDA onlyIDA totalIndiaIndonesiaIran, Islamic Rep.IraqIrelandIsraelItalyJamaicaJapanJordanKazakhstanKenyaKorea, Dem. People’s Rep.Korea, Rep.KosovoKuwaitKyrgyz RepublicLate-demographic dividendLatin America & Caribbean Latin America & Caribbean (excluding high income)Latin America & the Caribbean (IDA & IBRD countries)LatviaLeast developed countries: UN classificationLebanonLibyaLithuaniaLow & middle incomeLow incomeLower middle incomeLuxembourgMacedonia, FYRMalaysiaMaltaMauritiusMexicoMiddle East & North AfricaMiddle East & North Africa (excluding high income)Middle East & North Africa (IDA & IBRD countries)Middle incomeMoldovaMongoliaMontenegroMoroccoMozambiqueMyanmarNamibiaNepalNetherlandsNew ZealandNicaraguaNigerNigeriaNorth AmericaNorwayOECD membersOmanOther small statesPakistanPanamaParaguayPeruPhilippinesPolandPortugalPost-demographic dividendPre-demographic dividendQatarRomaniaRussian FederationSaudi ArabiaSenegalSerbiaSingaporeSlovak RepublicSloveniaSmall statesSouth AfricaSouth AsiaSouth Asia (IDA & IBRD)South SudanSpainSri LankaSub-Saharan Africa Sub-Saharan Africa (excluding high income)Sub-Saharan Africa (IDA & IBRD countries)SudanSwedenSwitzerlandSyrian Arab RepublicTajikistanTanzaniaThailandTogoTrinidad and TobagoTunisiaTurkeyTurkmenistanUkraineUnited Arab EmiratesUnited KingdomUnited StatesUpper middle incomeUruguayUzbekistanVenezuela, RBVietnamWorldYemen, Rep.ZambiaZimbabwe Timeline:
This timeline shows a graph from 1961 to 2014 of Europe & Central Asia (excluding high income). No data until 1960. Number of actual observations by date: 54.
Source name:
World Development Indicators
Source organization:
IEA Statistics © OECD/IEA 2014 (http://www.iea.org/stats/index.asp), subject to https://www.iea.org/t&c/termsandconditions/
Categories, topics:
Energy & Mining
Last updated:
apr 23, 2017
Indicators value changes by year
Maximum:
54.995
jan 1, 1961
At the date of observation
Value
Absolute change
Change from previous value
jan 1, 1961
54.995
+54.995
0.0%
jan 1, 1962
54.838
-0.157
-0.28%
jan 1, 1963
50.135
-4.703
-8.58%
jan 1, 1964
46.893
-3.242
-6.47%
jan 1, 1965
44.919
-1.974
-4.21%
jan 1, 1966
42.509
-2.41
-5.37%
jan 1, 1967
39.178
-3.331
-7.84%
jan 1, 1968
38.026
-1.152
-2.94%
jan 1, 1969
36.113
-1.913
-5.03%
jan 1, 1970
34.089
-2.024
-5.6%
jan 1, 1971
32.79
-1.299
-3.81%
jan 1, 1972
9.495
-23.295
-71.04%
jan 1, 1973
9.54
+0.045
0.47%
jan 1, 1974
8.931
-0.609
-6.39%
jan 1, 1975
8.726
-0.205
-2.3%
jan 1, 1976
8.372
-0.353
-4.05%
jan 1, 1977
7.931
-0.441
-5.27%
jan 1, 1978
7.495
-0.436
-5.5%
jan 1, 1979
7.349
-0.146
-1.95%
jan 1, 1980
7.457
+0.109
1.48%
jan 1, 1981
7.185
-0.272
-3.65%
jan 1, 1982
7.396
+0.211
2.93%
jan 1, 1983
7.476
+0.08
1.08%
jan 1, 1984
7.39
-0.086
-1.15%
jan 1, 1985
7.159
-0.232
-3.13%
jan 1, 1986
7.068
-0.091
-1.26%
jan 1, 1987
6.828
-0.24
-3.4%
jan 1, 1988
6.291
-0.536
-7.86%
jan 1, 1989
6.195
-0.096
-1.53%
jan 1, 1990
6.021
-0.174
-2.8%
jan 1, 1991
1.485
-4.536
-75.33%
jan 1, 1992
1.467
-0.018
-1.21%
jan 1, 1993
1.724
+0.257
17.49%
jan 1, 1994
1.827
+0.103
5.97%
jan 1, 1995
1.728
-0.099
-5.41%
jan 1, 1996
1.837
+0.109
6.3%
jan 1, 1997
1.836
0.0
-0.03%
jan 1, 1998
1.938
+0.101
5.53%
jan 1, 1999
1.872
-0.066
-3.38%
jan 1, 2000
1.994
+0.121
6.48%
jan 1, 2001
1.931
-0.063
-3.16%
jan 1, 2002
1.846
-0.084
-4.37%
jan 1, 2003
1.829
-0.017
-0.91%
jan 1, 2004
1.718
-0.112
-6.11%
jan 1, 2005
1.787
+0.069
4.04%
jan 1, 2006
1.755
-0.032
-1.77%
jan 1, 2007
1.799
+0.044
2.5%
jan 1, 2008
1.771
-0.028
-1.57%
jan 1, 2009
1.753
-0.018
-1.04%
jan 1, 2010
1.906
+0.154
8.77%
jan 1, 2011
1.872
-0.034
-1.8%
jan 1, 2012
1.708
-0.164
-8.76%
jan 1, 2013
1.751
+0.043
2.5%
jan 1, 2014
1.885
+0.135
7.7%
Ranking of countries by current statistics by years


Comments: