29
/
en
AIzaSyAYiBZKx7MnpbEhh9jyipgxe19OcubqV5w
April 1, 2024
132964
Finland
FIN
true
2
1
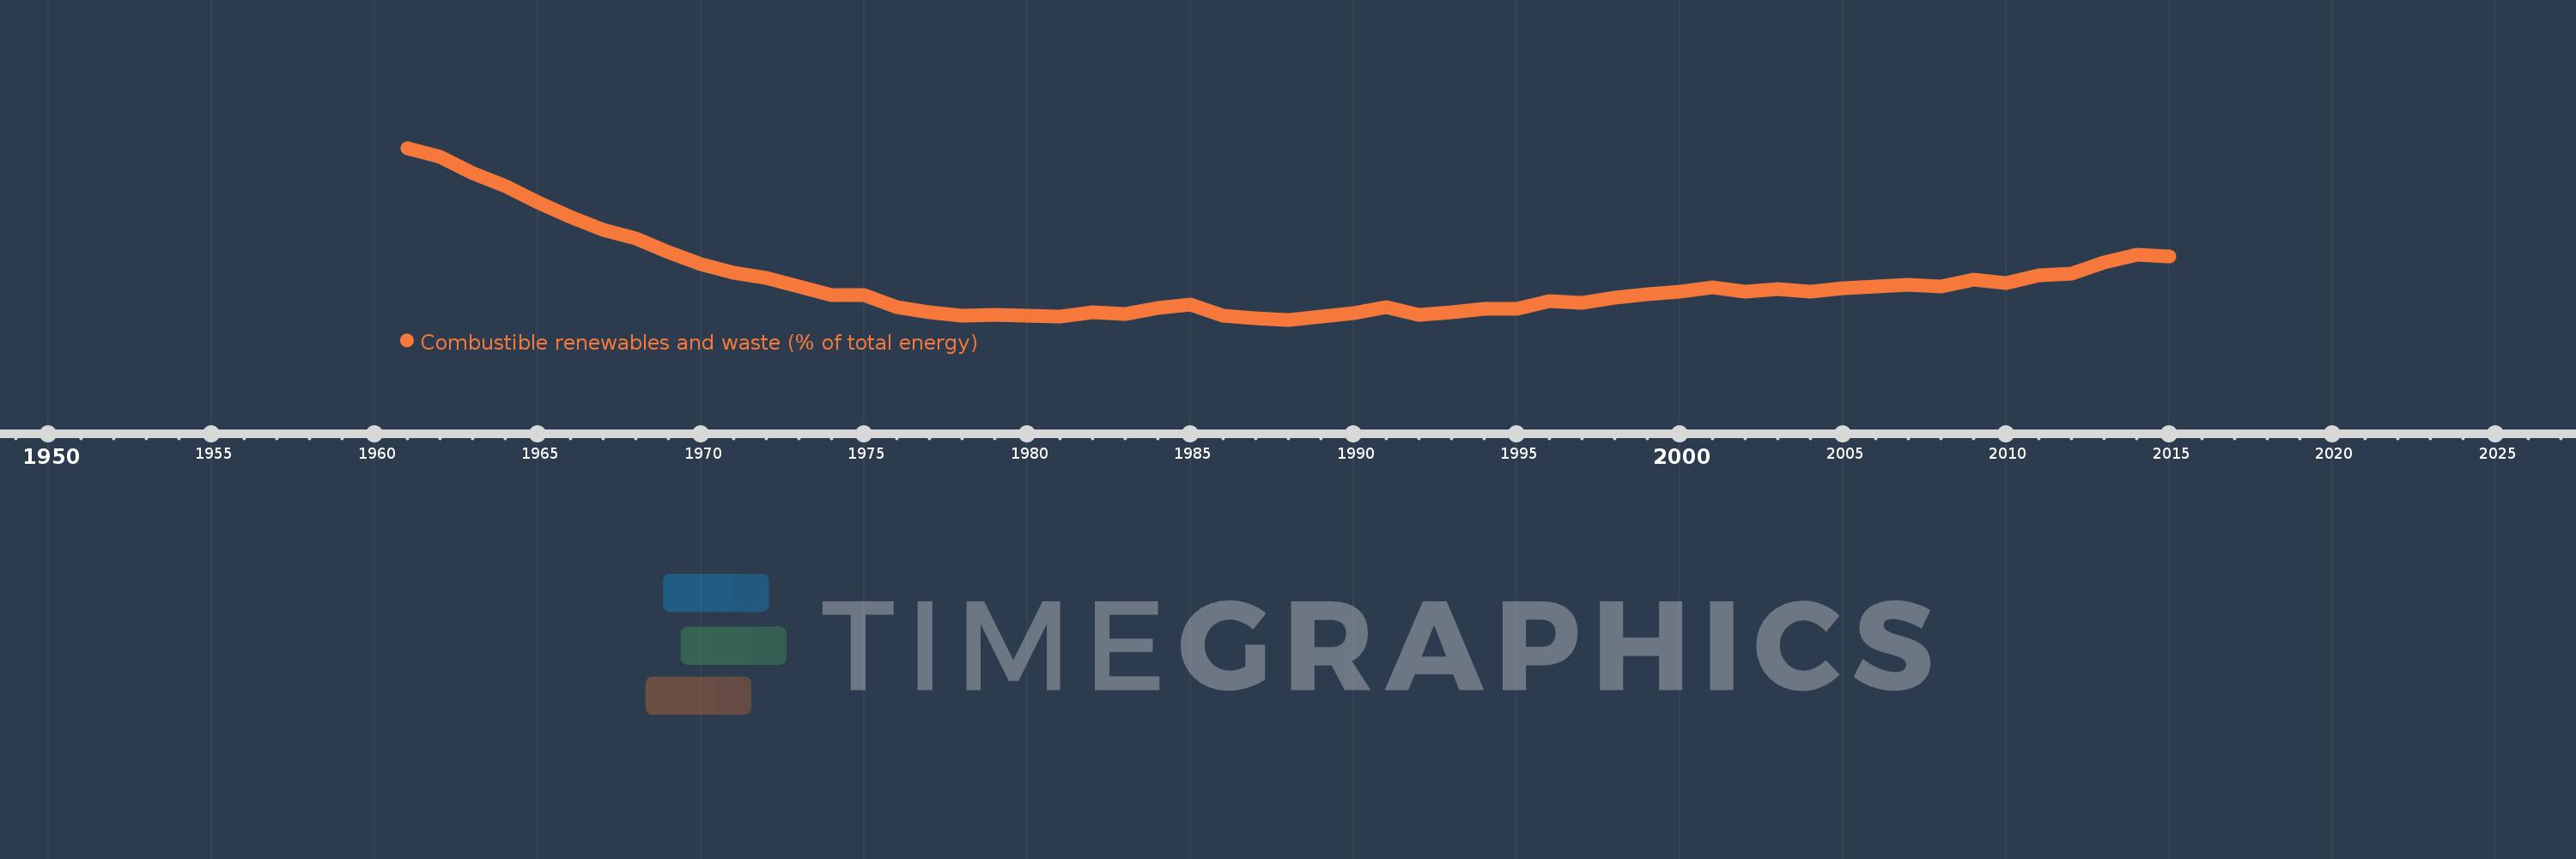
Combustible renewables and waste (% of total energy)
2015,2014,2013,2012,2011,2010,2009,2008,2007,2006,2005,2004,2003,2002,2001,2000,1999,1998,1997,1996,1995,1994,1993,1992,1991,1990,1989,1988,1987,1986,1985,1984,1983,1982,1981,1980,1979,1978,1977,1976,1975,1974,1973,1972,1971,1970,1969,1968,1967,1966,1965,1964,1963,1962,1961
This statistics in other country:
AlbaniaAlgeriaAngolaArab WorldArgentinaArmeniaAustraliaAustriaAzerbaijanBahrainBangladeshBelarusBelgiumBeninBoliviaBosnia and HerzegovinaBotswanaBrazilBrunei DarussalamBulgariaCambodiaCameroonCanadaCaribbean small statesCentral Europe and the BalticsChileChinaColombiaCongo, Dem. Rep.Congo, Rep.Costa RicaCote d'IvoireCroatiaCubaCuracaoCyprusCzech RepublicDenmarkDominican RepublicEarly-demographic dividendEast Asia & PacificEast Asia & Pacific (excluding high income)East Asia & Pacific (IDA & IBRD countries)EcuadorEgypt, Arab Rep.El SalvadorEritreaEstoniaEthiopiaEuro areaEurope & Central AsiaEurope & Central Asia (excluding high income)Europe & Central Asia (IDA & IBRD countries)European UnionFinlandFragile and conflict affected situationsFranceGabonGeorgiaGermanyGhanaGibraltarGreeceGuatemalaHaitiHeavily indebted poor countries (HIPC)High incomeHondurasHong Kong SAR, ChinaHungaryIBRD onlyIcelandIDA & IBRD totalIDA blendIDA onlyIDA totalIndiaIndonesiaIran, Islamic Rep.IraqIrelandIsraelItalyJamaicaJapanJordanKazakhstanKenyaKorea, Dem. People’s Rep.Korea, Rep.KosovoKuwaitKyrgyz RepublicLate-demographic dividendLatin America & Caribbean Latin America & Caribbean (excluding high income)Latin America & the Caribbean (IDA & IBRD countries)LatviaLeast developed countries: UN classificationLebanonLibyaLithuaniaLow & middle incomeLow incomeLower middle incomeLuxembourgMacedonia, FYRMalaysiaMaltaMauritiusMexicoMiddle East & North AfricaMiddle East & North Africa (excluding high income)Middle East & North Africa (IDA & IBRD countries)Middle incomeMoldovaMongoliaMontenegroMoroccoMozambiqueMyanmarNamibiaNepalNetherlandsNew ZealandNicaraguaNigerNigeriaNorth AmericaNorwayOECD membersOmanOther small statesPakistanPanamaParaguayPeruPhilippinesPolandPortugalPost-demographic dividendPre-demographic dividendQatarRomaniaRussian FederationSaudi ArabiaSenegalSerbiaSingaporeSlovak RepublicSloveniaSmall statesSouth AfricaSouth AsiaSouth Asia (IDA & IBRD)South SudanSpainSri LankaSub-Saharan Africa Sub-Saharan Africa (excluding high income)Sub-Saharan Africa (IDA & IBRD countries)SudanSwedenSwitzerlandSyrian Arab RepublicTajikistanTanzaniaThailandTogoTrinidad and TobagoTunisiaTurkeyTurkmenistanUkraineUnited Arab EmiratesUnited KingdomUnited StatesUpper middle incomeUruguayUzbekistanVenezuela, RBVietnamWorldYemen, Rep.ZambiaZimbabwe Timeline:
This timeline shows a graph from 1961 to 2015 of Finland. No data until 1960. Number of actual observations by date: 55.
Source name:
World Development Indicators
Source organization:
IEA Statistics © OECD/IEA 2014 (http://www.iea.org/stats/index.asp), subject to https://www.iea.org/t&c/termsandconditions/
Categories, topics:
Energy & Mining
Last updated:
apr 23, 2017
Indicators value changes by year
Minimum:
13.525
jan 1, 1988
Maximum:
49.423
jan 1, 1961
At the date of observation
Value
Absolute change
Change from previous value
jan 1, 1961
49.423
+49.423
0.0%
jan 1, 1962
47.582
-1.841
-3.73%
jan 1, 1963
44.25
-3.331
-7.0%
jan 1, 1964
41.438
-2.812
-6.35%
jan 1, 1965
38.136
-3.302
-7.97%
jan 1, 1966
35.027
-3.11
-8.15%
jan 1, 1967
32.404
-2.623
-7.49%
jan 1, 1968
30.573
-1.831
-5.65%
jan 1, 1969
27.691
-2.882
-9.43%
jan 1, 1970
25.116
-2.575
-9.3%
jan 1, 1971
23.425
-1.691
-6.73%
jan 1, 1972
22.282
-1.143
-4.88%
jan 1, 1973
20.411
-1.871
-8.4%
jan 1, 1974
18.74
-1.671
-8.19%
jan 1, 1975
18.759
+0.019
0.1%
jan 1, 1976
16.102
-2.657
-14.16%
jan 1, 1977
15.054
-1.047
-6.51%
jan 1, 1978
14.446
-0.608
-4.04%
jan 1, 1979
14.591
+0.145
1.0%
jan 1, 1980
14.439
-0.152
-1.04%
jan 1, 1981
14.119
-0.321
-2.22%
jan 1, 1982
15.147
+1.028
7.28%
jan 1, 1983
14.679
-0.468
-3.09%
jan 1, 1984
15.991
+1.312
8.94%
jan 1, 1985
16.774
+0.783
4.89%
jan 1, 1986
14.42
-2.354
-14.04%
jan 1, 1987
13.901
-0.518
-3.6%
jan 1, 1988
13.525
-0.376
-2.71%
jan 1, 1989
14.257
+0.733
5.42%
jan 1, 1990
14.918
+0.661
4.63%
jan 1, 1991
16.077
+1.159
7.77%
jan 1, 1992
14.546
-1.531
-9.52%
jan 1, 1993
15.066
+0.519
3.57%
jan 1, 1994
15.808
+0.743
4.93%
jan 1, 1995
15.753
-0.055
-0.35%
jan 1, 1996
17.355
+1.602
10.17%
jan 1, 1997
17.04
-0.315
-1.82%
jan 1, 1998
18.191
+1.151
6.76%
jan 1, 1999
18.787
+0.596
3.28%
jan 1, 2000
19.37
+0.583
3.1%
jan 1, 2001
20.28
+0.909
4.69%
jan 1, 2002
19.364
-0.916
-4.51%
jan 1, 2003
19.926
+0.562
2.9%
jan 1, 2004
19.333
-0.593
-2.98%
jan 1, 2005
20.142
+0.808
4.18%
jan 1, 2006
20.389
+0.247
1.23%
jan 1, 2007
20.841
+0.452
2.21%
jan 1, 2008
20.403
-0.437
-2.1%
jan 1, 2009
21.952
+1.548
7.59%
jan 1, 2010
21.208
-0.744
-3.39%
jan 1, 2011
22.831
+1.623
7.65%
jan 1, 2012
23.207
+0.377
1.65%
jan 1, 2013
25.521
+2.314
9.97%
jan 1, 2014
27.074
+1.553
6.09%
jan 1, 2015
26.702
-0.372
-1.38%
Ranking of countries by current statistics by years


Comments: