29
/
en
AIzaSyAYiBZKx7MnpbEhh9jyipgxe19OcubqV5w
April 1, 2024
261997
Thailand
THA
true
2
1
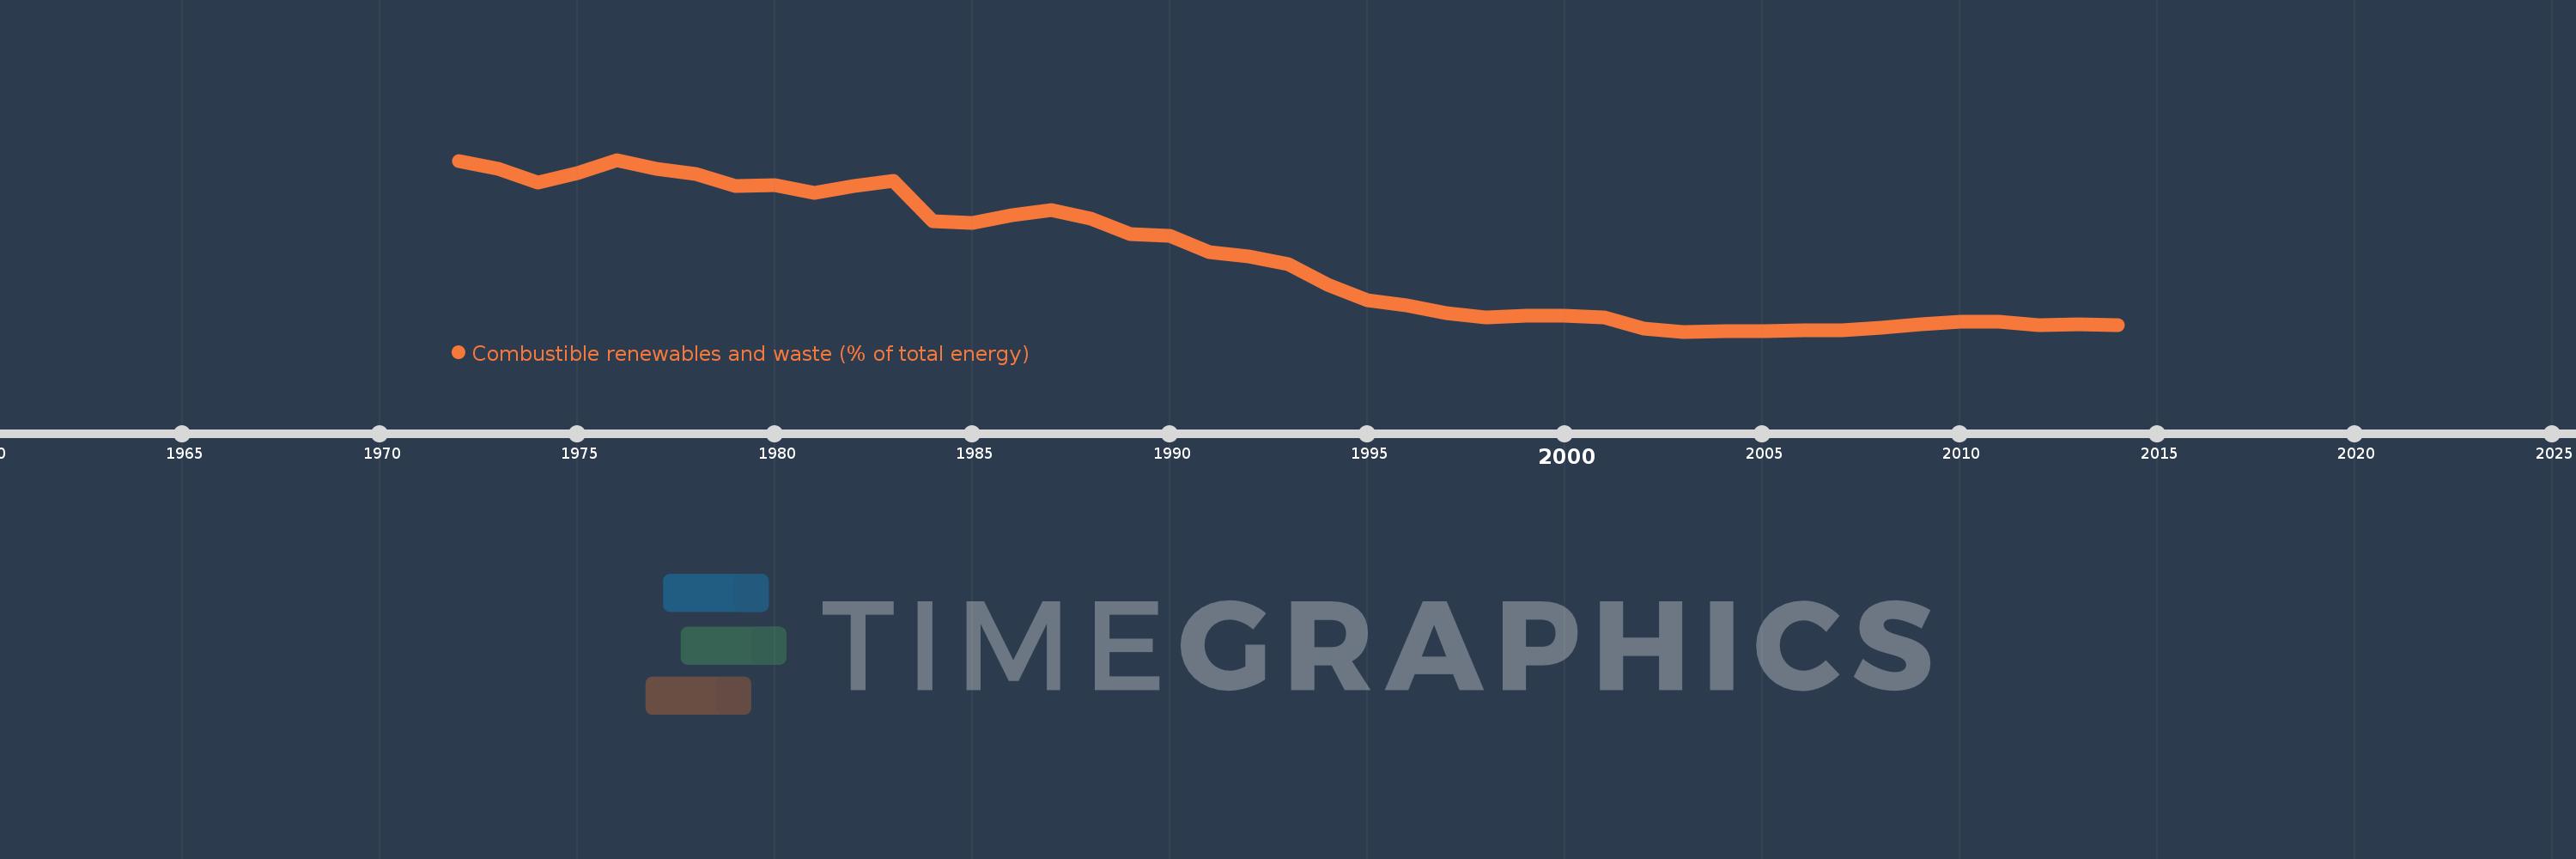
Combustible renewables and waste (% of total energy)
2014,2013,2012,2011,2010,2009,2008,2007,2006,2005,2004,2003,2002,2001,2000,1999,1998,1997,1996,1995,1994,1993,1992,1991,1990,1989,1988,1987,1986,1985,1984,1983,1982,1981,1980,1979,1978,1977,1976,1975,1974,1973,1972
This statistics in other country:
AlbaniaAlgeriaAngolaArab WorldArgentinaArmeniaAustraliaAustriaAzerbaijanBahrainBangladeshBelarusBelgiumBeninBoliviaBosnia and HerzegovinaBotswanaBrazilBrunei DarussalamBulgariaCambodiaCameroonCanadaCaribbean small statesCentral Europe and the BalticsChileChinaColombiaCongo, Dem. Rep.Congo, Rep.Costa RicaCote d'IvoireCroatiaCubaCuracaoCyprusCzech RepublicDenmarkDominican RepublicEarly-demographic dividendEast Asia & PacificEast Asia & Pacific (excluding high income)East Asia & Pacific (IDA & IBRD countries)EcuadorEgypt, Arab Rep.El SalvadorEritreaEstoniaEthiopiaEuro areaEurope & Central AsiaEurope & Central Asia (excluding high income)Europe & Central Asia (IDA & IBRD countries)European UnionFinlandFragile and conflict affected situationsFranceGabonGeorgiaGermanyGhanaGibraltarGreeceGuatemalaHaitiHeavily indebted poor countries (HIPC)High incomeHondurasHong Kong SAR, ChinaHungaryIBRD onlyIcelandIDA & IBRD totalIDA blendIDA onlyIDA totalIndiaIndonesiaIran, Islamic Rep.IraqIrelandIsraelItalyJamaicaJapanJordanKazakhstanKenyaKorea, Dem. People’s Rep.Korea, Rep.KosovoKuwaitKyrgyz RepublicLate-demographic dividendLatin America & Caribbean Latin America & Caribbean (excluding high income)Latin America & the Caribbean (IDA & IBRD countries)LatviaLeast developed countries: UN classificationLebanonLibyaLithuaniaLow & middle incomeLow incomeLower middle incomeLuxembourgMacedonia, FYRMalaysiaMaltaMauritiusMexicoMiddle East & North AfricaMiddle East & North Africa (excluding high income)Middle East & North Africa (IDA & IBRD countries)Middle incomeMoldovaMongoliaMontenegroMoroccoMozambiqueMyanmarNamibiaNepalNetherlandsNew ZealandNicaraguaNigerNigeriaNorth AmericaNorwayOECD membersOmanOther small statesPakistanPanamaParaguayPeruPhilippinesPolandPortugalPost-demographic dividendPre-demographic dividendQatarRomaniaRussian FederationSaudi ArabiaSenegalSerbiaSingaporeSlovak RepublicSloveniaSmall statesSouth AfricaSouth AsiaSouth Asia (IDA & IBRD)South SudanSpainSri LankaSub-Saharan Africa Sub-Saharan Africa (excluding high income)Sub-Saharan Africa (IDA & IBRD countries)SudanSwedenSwitzerlandSyrian Arab RepublicTajikistanTanzaniaThailandTogoTrinidad and TobagoTunisiaTurkeyTurkmenistanUkraineUnited Arab EmiratesUnited KingdomUnited StatesUpper middle incomeUruguayUzbekistanVenezuela, RBVietnamWorldYemen, Rep.ZambiaZimbabwe Timeline:
This timeline shows a graph from 1972 to 2014 of Thailand. No data until 1971. Number of actual observations by date: 43.
Source name:
World Development Indicators
Source organization:
IEA Statistics © OECD/IEA 2014 (http://www.iea.org/stats/index.asp), subject to https://www.iea.org/t&c/termsandconditions/
Categories, topics:
Energy & Mining
Last updated:
apr 23, 2017
Indicators value changes by year
Minimum:
17.023
jan 1, 2003
Maximum:
55.899
jan 1, 1976
At the date of observation
Value
Absolute change
Change from previous value
jan 1, 1972
55.523
+55.523
0.0%
jan 1, 1973
53.82
-1.703
-3.07%
jan 1, 1974
50.694
-3.126
-5.81%
jan 1, 1975
52.919
+2.226
4.39%
jan 1, 1976
55.899
+2.98
5.63%
jan 1, 1977
53.863
-2.036
-3.64%
jan 1, 1978
52.717
-1.146
-2.13%
jan 1, 1979
49.997
-2.72
-5.16%
jan 1, 1980
50.142
+0.145
0.29%
jan 1, 1981
48.391
-1.751
-3.49%
jan 1, 1982
49.991
+1.6
3.31%
jan 1, 1983
51.221
+1.23
2.46%
jan 1, 1984
42.031
-9.191
-17.94%
jan 1, 1985
41.551
-0.48
-1.14%
jan 1, 1986
43.348
+1.797
4.33%
jan 1, 1987
44.524
+1.176
2.71%
jan 1, 1988
42.5
-2.025
-4.55%
jan 1, 1989
39.028
-3.472
-8.17%
jan 1, 1990
38.767
-0.261
-0.67%
jan 1, 1991
35.013
-3.754
-9.68%
jan 1, 1992
33.935
-1.077
-3.08%
jan 1, 1993
32.303
-1.632
-4.81%
jan 1, 1994
27.543
-4.761
-14.74%
jan 1, 1995
24.051
-3.492
-12.68%
jan 1, 1996
22.998
-1.053
-4.38%
jan 1, 1997
21.161
-1.837
-7.99%
jan 1, 1998
20.205
-0.956
-4.52%
jan 1, 1999
20.567
+0.362
1.79%
jan 1, 2000
20.613
+0.046
0.22%
jan 1, 2001
20.207
-0.406
-1.97%
jan 1, 2002
17.772
-2.435
-12.05%
jan 1, 2003
17.023
-0.749
-4.22%
jan 1, 2004
17.052
+0.028
0.17%
jan 1, 2005
17.132
+0.081
0.47%
jan 1, 2006
17.353
+0.221
1.29%
jan 1, 2007
17.369
+0.016
0.09%
jan 1, 2008
17.892
+0.522
3.01%
jan 1, 2009
18.735
+0.843
4.71%
jan 1, 2010
19.224
+0.489
2.61%
jan 1, 2011
19.186
-0.038
-0.2%
jan 1, 2012
18.541
-0.645
-3.36%
jan 1, 2013
18.624
+0.082
0.44%
jan 1, 2014
18.389
-0.235
-1.26%
Ranking of countries by current statistics by years


Comments: