29
/
en
AIzaSyAYiBZKx7MnpbEhh9jyipgxe19OcubqV5w
April 1, 2024
282040
Vietnam
VNM
true
2
1
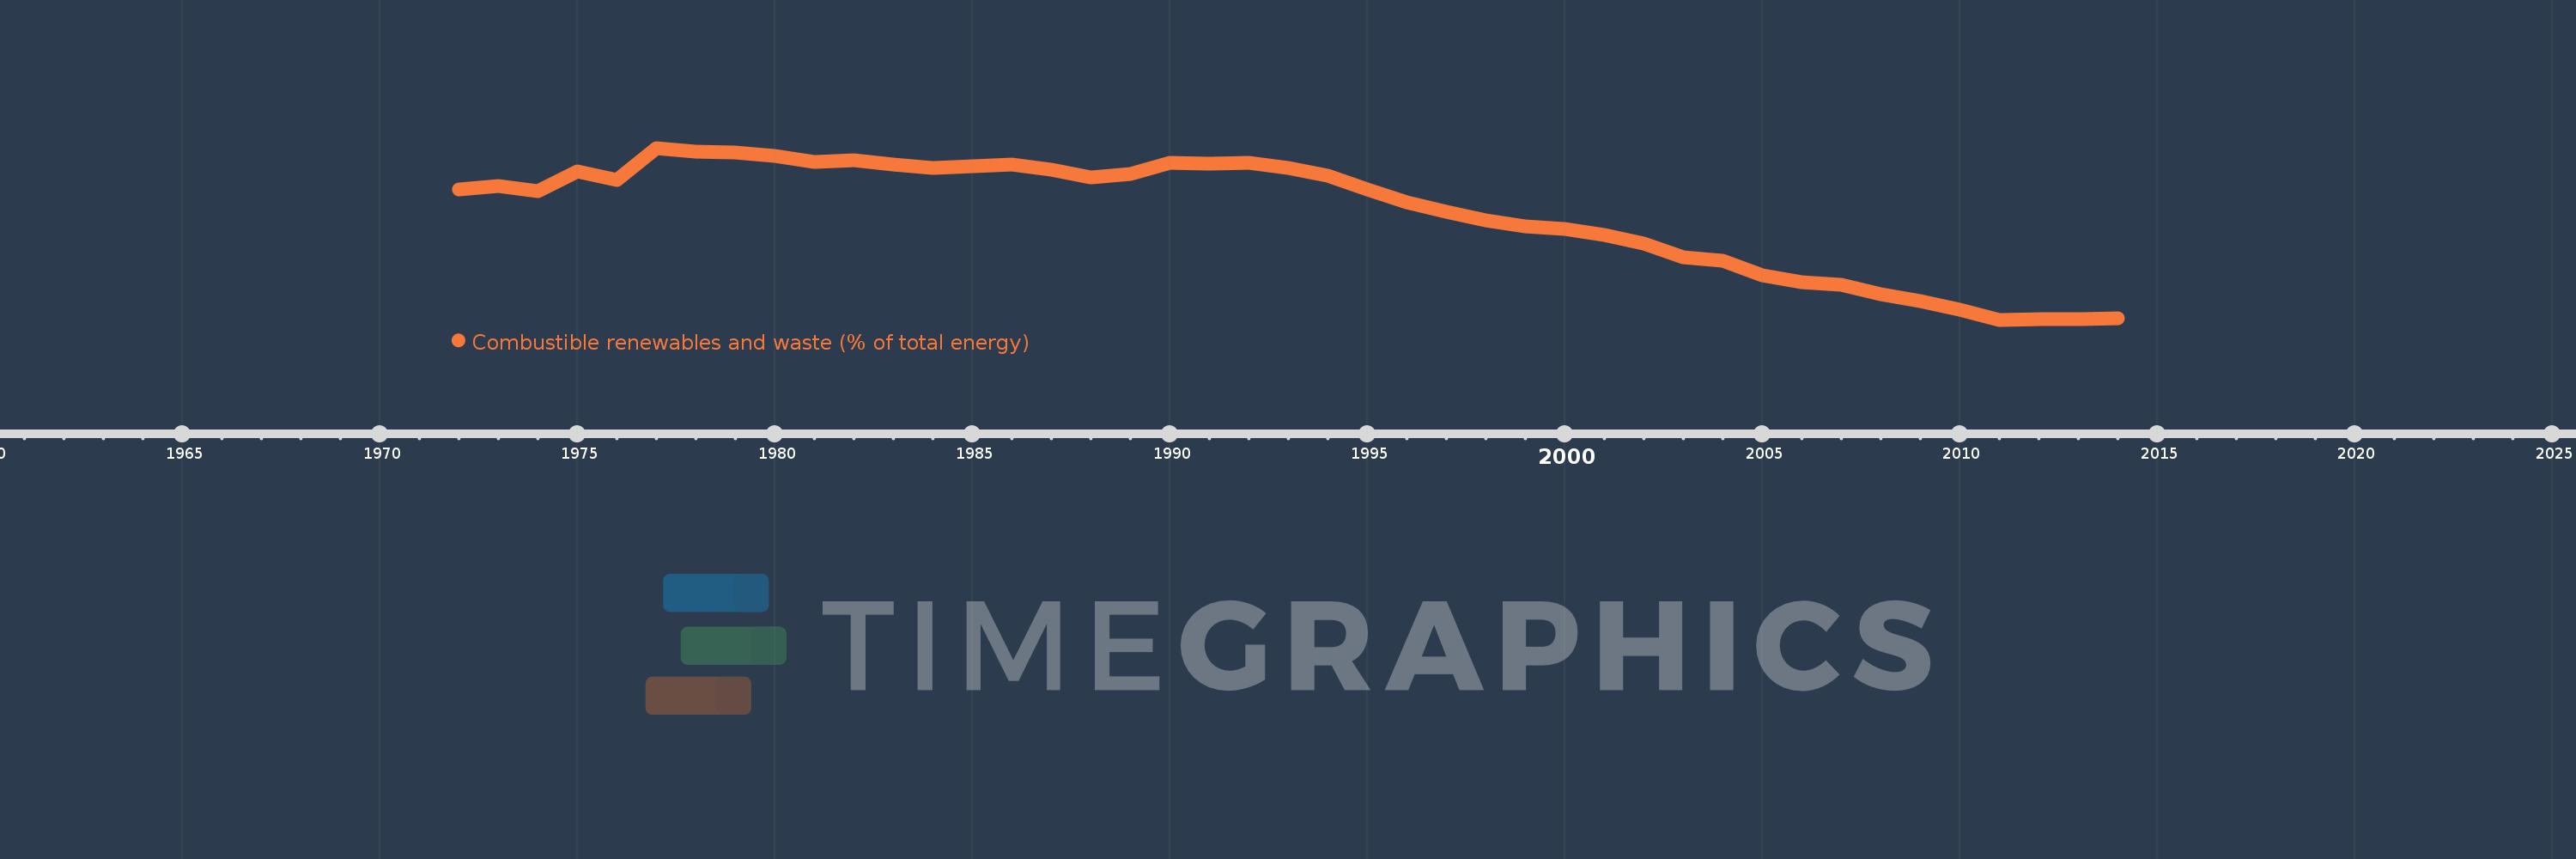
Combustible renewables and waste (% of total energy)
2014,2013,2012,2011,2010,2009,2008,2007,2006,2005,2004,2003,2002,2001,2000,1999,1998,1997,1996,1995,1994,1993,1992,1991,1990,1989,1988,1987,1986,1985,1984,1983,1982,1981,1980,1979,1978,1977,1976,1975,1974,1973,1972
This statistics in other country:
AlbaniaAlgeriaAngolaArab WorldArgentinaArmeniaAustraliaAustriaAzerbaijanBahrainBangladeshBelarusBelgiumBeninBoliviaBosnia and HerzegovinaBotswanaBrazilBrunei DarussalamBulgariaCambodiaCameroonCanadaCaribbean small statesCentral Europe and the BalticsChileChinaColombiaCongo, Dem. Rep.Congo, Rep.Costa RicaCote d'IvoireCroatiaCubaCuracaoCyprusCzech RepublicDenmarkDominican RepublicEarly-demographic dividendEast Asia & PacificEast Asia & Pacific (excluding high income)East Asia & Pacific (IDA & IBRD countries)EcuadorEgypt, Arab Rep.El SalvadorEritreaEstoniaEthiopiaEuro areaEurope & Central AsiaEurope & Central Asia (excluding high income)Europe & Central Asia (IDA & IBRD countries)European UnionFinlandFragile and conflict affected situationsFranceGabonGeorgiaGermanyGhanaGibraltarGreeceGuatemalaHaitiHeavily indebted poor countries (HIPC)High incomeHondurasHong Kong SAR, ChinaHungaryIBRD onlyIcelandIDA & IBRD totalIDA blendIDA onlyIDA totalIndiaIndonesiaIran, Islamic Rep.IraqIrelandIsraelItalyJamaicaJapanJordanKazakhstanKenyaKorea, Dem. People’s Rep.Korea, Rep.KosovoKuwaitKyrgyz RepublicLate-demographic dividendLatin America & Caribbean Latin America & Caribbean (excluding high income)Latin America & the Caribbean (IDA & IBRD countries)LatviaLeast developed countries: UN classificationLebanonLibyaLithuaniaLow & middle incomeLow incomeLower middle incomeLuxembourgMacedonia, FYRMalaysiaMaltaMauritiusMexicoMiddle East & North AfricaMiddle East & North Africa (excluding high income)Middle East & North Africa (IDA & IBRD countries)Middle incomeMoldovaMongoliaMontenegroMoroccoMozambiqueMyanmarNamibiaNepalNetherlandsNew ZealandNicaraguaNigerNigeriaNorth AmericaNorwayOECD membersOmanOther small statesPakistanPanamaParaguayPeruPhilippinesPolandPortugalPost-demographic dividendPre-demographic dividendQatarRomaniaRussian FederationSaudi ArabiaSenegalSerbiaSingaporeSlovak RepublicSloveniaSmall statesSouth AfricaSouth AsiaSouth Asia (IDA & IBRD)South SudanSpainSri LankaSub-Saharan Africa Sub-Saharan Africa (excluding high income)Sub-Saharan Africa (IDA & IBRD countries)SudanSwedenSwitzerlandSyrian Arab RepublicTajikistanTanzaniaThailandTogoTrinidad and TobagoTunisiaTurkeyTurkmenistanUkraineUnited Arab EmiratesUnited KingdomUnited StatesUpper middle incomeUruguayUzbekistanVenezuela, RBVietnamWorldYemen, Rep.ZambiaZimbabwe Timeline:
This timeline shows a graph from 1972 to 2014 of Vietnam. No data until 1971. Number of actual observations by date: 43.
Source name:
World Development Indicators
Source organization:
IEA Statistics © OECD/IEA 2014 (http://www.iea.org/stats/index.asp), subject to https://www.iea.org/t&c/termsandconditions/
Categories, topics:
Energy & Mining
Last updated:
apr 23, 2017
Indicators value changes by year
Minimum:
24.965
jan 1, 2011
Maximum:
74.375
jan 1, 1977
At the date of observation
Value
Absolute change
Change from previous value
jan 1, 1972
62.456
+62.456
0.0%
jan 1, 1973
63.344
+0.888
1.42%
jan 1, 1974
62.014
-1.331
-2.1%
jan 1, 1975
67.71
+5.696
9.18%
jan 1, 1976
65.226
-2.483
-3.67%
jan 1, 1977
74.375
+9.149
14.03%
jan 1, 1978
73.24
-1.135
-1.53%
jan 1, 1979
73.009
-0.231
-0.32%
jan 1, 1980
72.14
-0.869
-1.19%
jan 1, 1981
70.471
-1.669
-2.31%
jan 1, 1982
70.913
+0.442
0.63%
jan 1, 1983
69.65
-1.263
-1.78%
jan 1, 1984
68.647
-1.004
-1.44%
jan 1, 1985
69.078
+0.431
0.63%
jan 1, 1986
69.634
+0.556
0.81%
jan 1, 1987
68.022
-1.612
-2.31%
jan 1, 1988
65.885
-2.137
-3.14%
jan 1, 1989
66.875
+0.99
1.5%
jan 1, 1990
70.051
+3.176
4.75%
jan 1, 1991
69.788
-0.263
-0.38%
jan 1, 1992
70.174
+0.387
0.55%
jan 1, 1993
68.606
-1.569
-2.24%
jan 1, 1994
66.293
-2.313
-3.37%
jan 1, 1995
62.514
-3.779
-5.7%
jan 1, 1996
58.805
-3.71
-5.93%
jan 1, 1997
55.942
-2.862
-4.87%
jan 1, 1998
53.524
-2.418
-4.32%
jan 1, 1999
51.736
-1.789
-3.34%
jan 1, 2000
51.191
-0.544
-1.05%
jan 1, 2001
49.372
-1.819
-3.55%
jan 1, 2002
46.976
-2.396
-4.85%
jan 1, 2003
43.049
-3.927
-8.36%
jan 1, 2004
41.835
-1.214
-2.82%
jan 1, 2005
37.804
-4.03
-9.63%
jan 1, 2006
35.855
-1.95
-5.16%
jan 1, 2007
34.926
-0.928
-2.59%
jan 1, 2008
32.418
-2.509
-7.18%
jan 1, 2009
30.272
-2.146
-6.62%
jan 1, 2010
27.739
-2.533
-8.37%
jan 1, 2011
24.965
-2.774
-10.0%
jan 1, 2012
25.238
+0.273
1.09%
jan 1, 2013
25.062
-0.176
-0.7%
jan 1, 2014
25.326
+0.264
1.05%
Ranking of countries by current statistics by years


Comments: