29
/
en
AIzaSyAYiBZKx7MnpbEhh9jyipgxe19OcubqV5w
April 1, 2024
161289
Italy
ITA
true
2
1
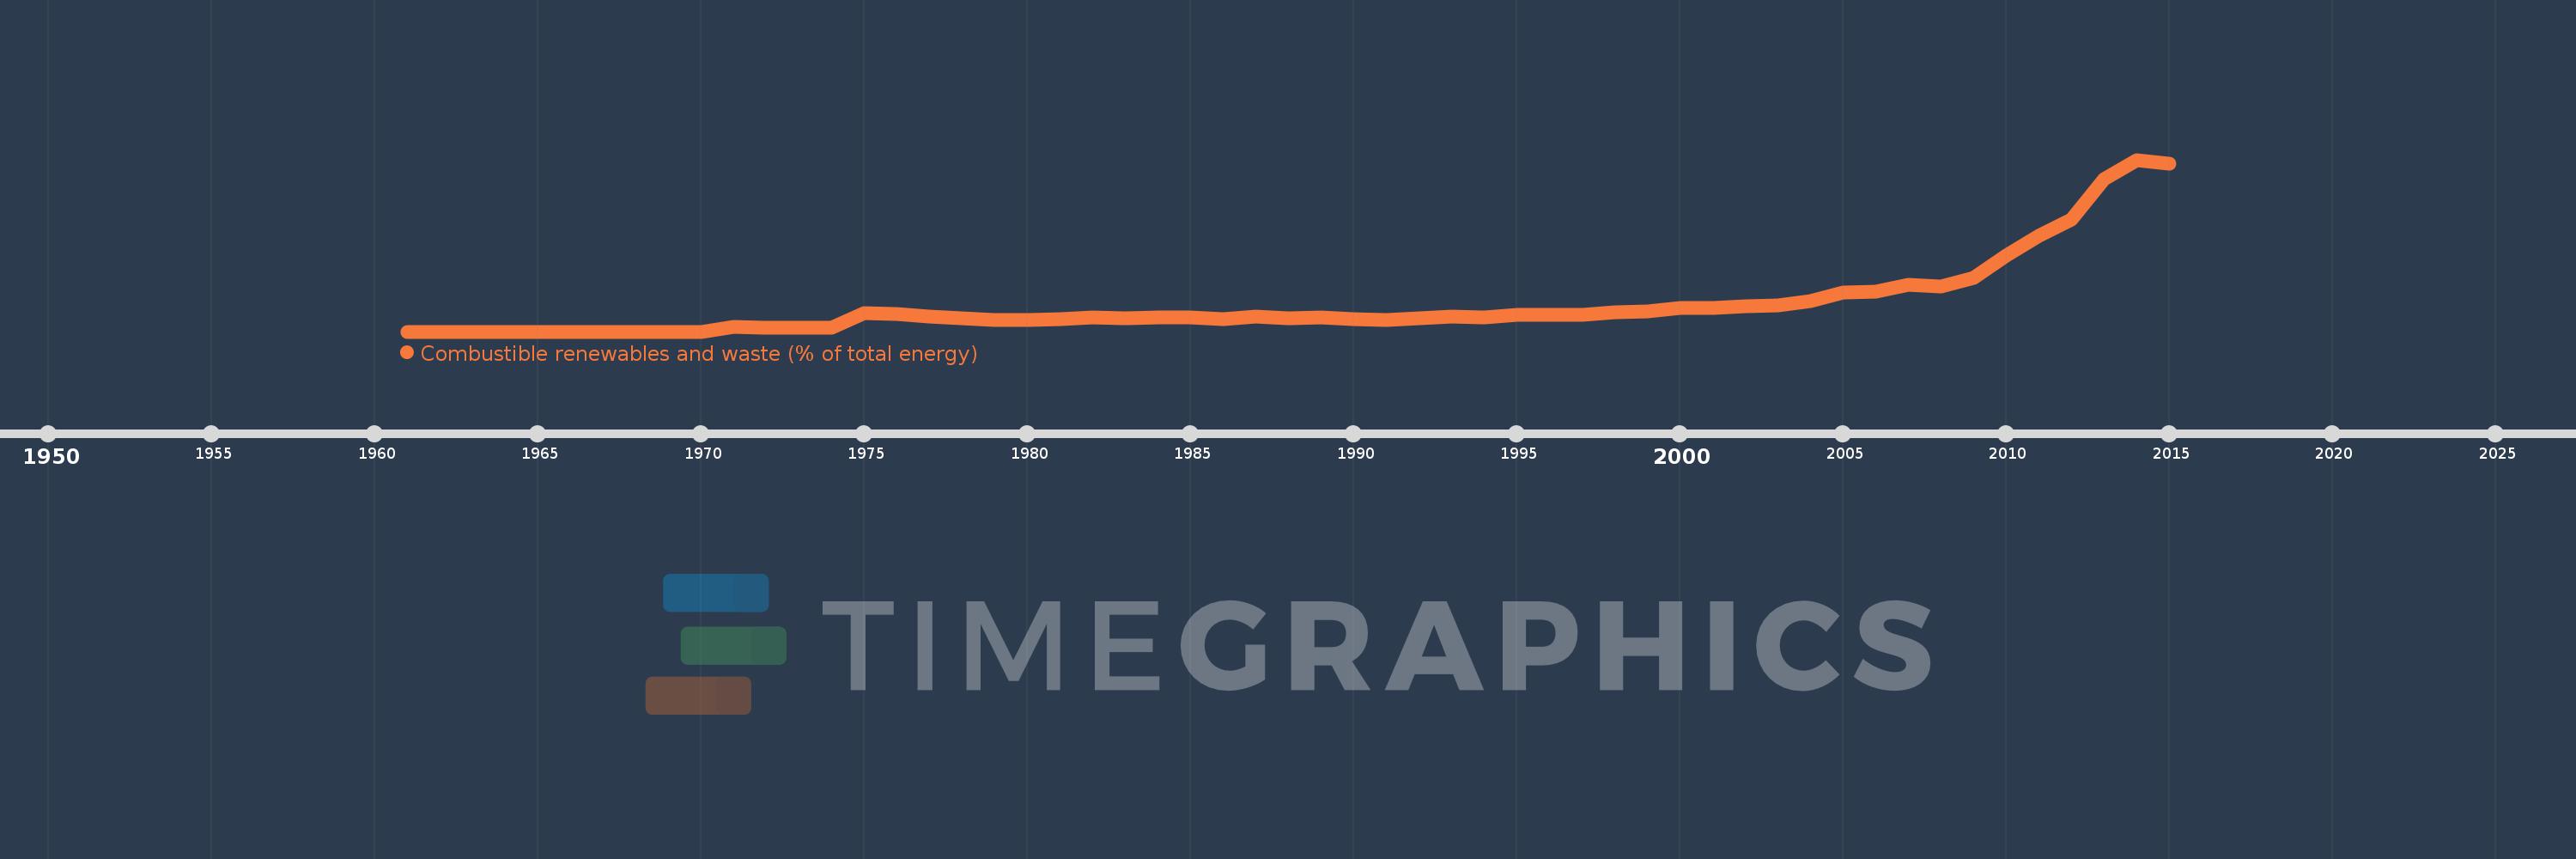
Combustible renewables and waste (% of total energy)
2015,2014,2013,2012,2011,2010,2009,2008,2007,2006,2005,2004,2003,2002,2001,2000,1999,1998,1997,1996,1995,1994,1993,1992,1991,1990,1989,1988,1987,1986,1985,1984,1983,1982,1981,1980,1979,1978,1977,1976,1975,1974,1973,1972,1971,1970,1969,1968,1967,1966,1965,1964,1963,1962,1961
This statistics in other country:
AlbaniaAlgeriaAngolaArab WorldArgentinaArmeniaAustraliaAustriaAzerbaijanBahrainBangladeshBelarusBelgiumBeninBoliviaBosnia and HerzegovinaBotswanaBrazilBrunei DarussalamBulgariaCambodiaCameroonCanadaCaribbean small statesCentral Europe and the BalticsChileChinaColombiaCongo, Dem. Rep.Congo, Rep.Costa RicaCote d'IvoireCroatiaCubaCuracaoCyprusCzech RepublicDenmarkDominican RepublicEarly-demographic dividendEast Asia & PacificEast Asia & Pacific (excluding high income)East Asia & Pacific (IDA & IBRD countries)EcuadorEgypt, Arab Rep.El SalvadorEritreaEstoniaEthiopiaEuro areaEurope & Central AsiaEurope & Central Asia (excluding high income)Europe & Central Asia (IDA & IBRD countries)European UnionFinlandFragile and conflict affected situationsFranceGabonGeorgiaGermanyGhanaGibraltarGreeceGuatemalaHaitiHeavily indebted poor countries (HIPC)High incomeHondurasHong Kong SAR, ChinaHungaryIBRD onlyIcelandIDA & IBRD totalIDA blendIDA onlyIDA totalIndiaIndonesiaIran, Islamic Rep.IraqIrelandIsraelItalyJamaicaJapanJordanKazakhstanKenyaKorea, Dem. People’s Rep.Korea, Rep.KosovoKuwaitKyrgyz RepublicLate-demographic dividendLatin America & Caribbean Latin America & Caribbean (excluding high income)Latin America & the Caribbean (IDA & IBRD countries)LatviaLeast developed countries: UN classificationLebanonLibyaLithuaniaLow & middle incomeLow incomeLower middle incomeLuxembourgMacedonia, FYRMalaysiaMaltaMauritiusMexicoMiddle East & North AfricaMiddle East & North Africa (excluding high income)Middle East & North Africa (IDA & IBRD countries)Middle incomeMoldovaMongoliaMontenegroMoroccoMozambiqueMyanmarNamibiaNepalNetherlandsNew ZealandNicaraguaNigerNigeriaNorth AmericaNorwayOECD membersOmanOther small statesPakistanPanamaParaguayPeruPhilippinesPolandPortugalPost-demographic dividendPre-demographic dividendQatarRomaniaRussian FederationSaudi ArabiaSenegalSerbiaSingaporeSlovak RepublicSloveniaSmall statesSouth AfricaSouth AsiaSouth Asia (IDA & IBRD)South SudanSpainSri LankaSub-Saharan Africa Sub-Saharan Africa (excluding high income)Sub-Saharan Africa (IDA & IBRD countries)SudanSwedenSwitzerlandSyrian Arab RepublicTajikistanTanzaniaThailandTogoTrinidad and TobagoTunisiaTurkeyTurkmenistanUkraineUnited Arab EmiratesUnited KingdomUnited StatesUpper middle incomeUruguayUzbekistanVenezuela, RBVietnamWorldYemen, Rep.ZambiaZimbabwe Timeline:
This timeline shows a graph from 1961 to 2015 of Italy. No data until 1960. Number of actual observations by date: 55.
Source name:
World Development Indicators
Source organization:
IEA Statistics © OECD/IEA 2014 (http://www.iea.org/stats/index.asp), subject to https://www.iea.org/t&c/termsandconditions/
Categories, topics:
Energy & Mining
Last updated:
apr 23, 2017
Indicators value changes by year
At the date of observation
Value
Absolute change
Change from previous value
jan 1, 1971
0.278
+0.278
%
jan 1, 1972
0.206
-0.072
-25.87%
jan 1, 1973
0.222
+0.015
7.37%
jan 1, 1974
0.205
-0.017
-7.67%
jan 1, 1975
0.997
+0.792
387.01%
jan 1, 1976
0.95
-0.046
-4.64%
jan 1, 1977
0.826
-0.124
-13.07%
jan 1, 1978
0.754
-0.072
-8.69%
jan 1, 1979
0.649
-0.105
-13.93%
jan 1, 1980
0.655
+0.006
0.9%
jan 1, 1981
0.7
+0.045
6.92%
jan 1, 1982
0.771
+0.071
10.13%
jan 1, 1983
0.753
-0.018
-2.37%
jan 1, 1984
0.773
+0.02
2.71%
jan 1, 1985
0.793
+0.02
2.54%
jan 1, 1986
0.68
-0.113
-14.28%
jan 1, 1987
0.829
+0.149
21.88%
jan 1, 1988
0.745
-0.084
-10.1%
jan 1, 1989
0.76
+0.015
1.99%
jan 1, 1990
0.69
-0.07
-9.16%
jan 1, 1991
0.642
-0.048
-7.0%
jan 1, 1992
0.717
+0.075
11.71%
jan 1, 1993
0.81
+0.093
12.99%
jan 1, 1994
0.773
-0.037
-4.61%
jan 1, 1995
0.93
+0.158
20.39%
jan 1, 1996
0.915
-0.015
-1.65%
jan 1, 1997
0.914
-0.001
-0.12%
jan 1, 1998
1.041
+0.127
13.92%
jan 1, 1999
1.13
+0.089
8.52%
jan 1, 2000
1.292
+0.162
14.32%
jan 1, 2001
1.312
+0.021
1.6%
jan 1, 2002
1.397
+0.085
6.45%
jan 1, 2003
1.442
+0.045
3.23%
jan 1, 2004
1.687
+0.245
16.98%
jan 1, 2005
2.167
+0.48
28.44%
jan 1, 2006
2.204
+0.038
1.74%
jan 1, 2007
2.584
+0.38
17.22%
jan 1, 2008
2.485
-0.099
-3.83%
jan 1, 2009
2.927
+0.442
17.77%
jan 1, 2010
4.175
+1.248
42.64%
jan 1, 2011
5.251
+1.076
25.76%
jan 1, 2012
6.13
+0.879
16.75%
jan 1, 2013
8.379
+2.249
36.69%
jan 1, 2014
9.426
+1.047
12.5%
jan 1, 2015
9.224
-0.203
-2.15%
Ranking of countries by current statistics by years


Comments: