29
/
en
AIzaSyAYiBZKx7MnpbEhh9jyipgxe19OcubqV5w
April 1, 2024
100924
Canada
CAN
true
2
1
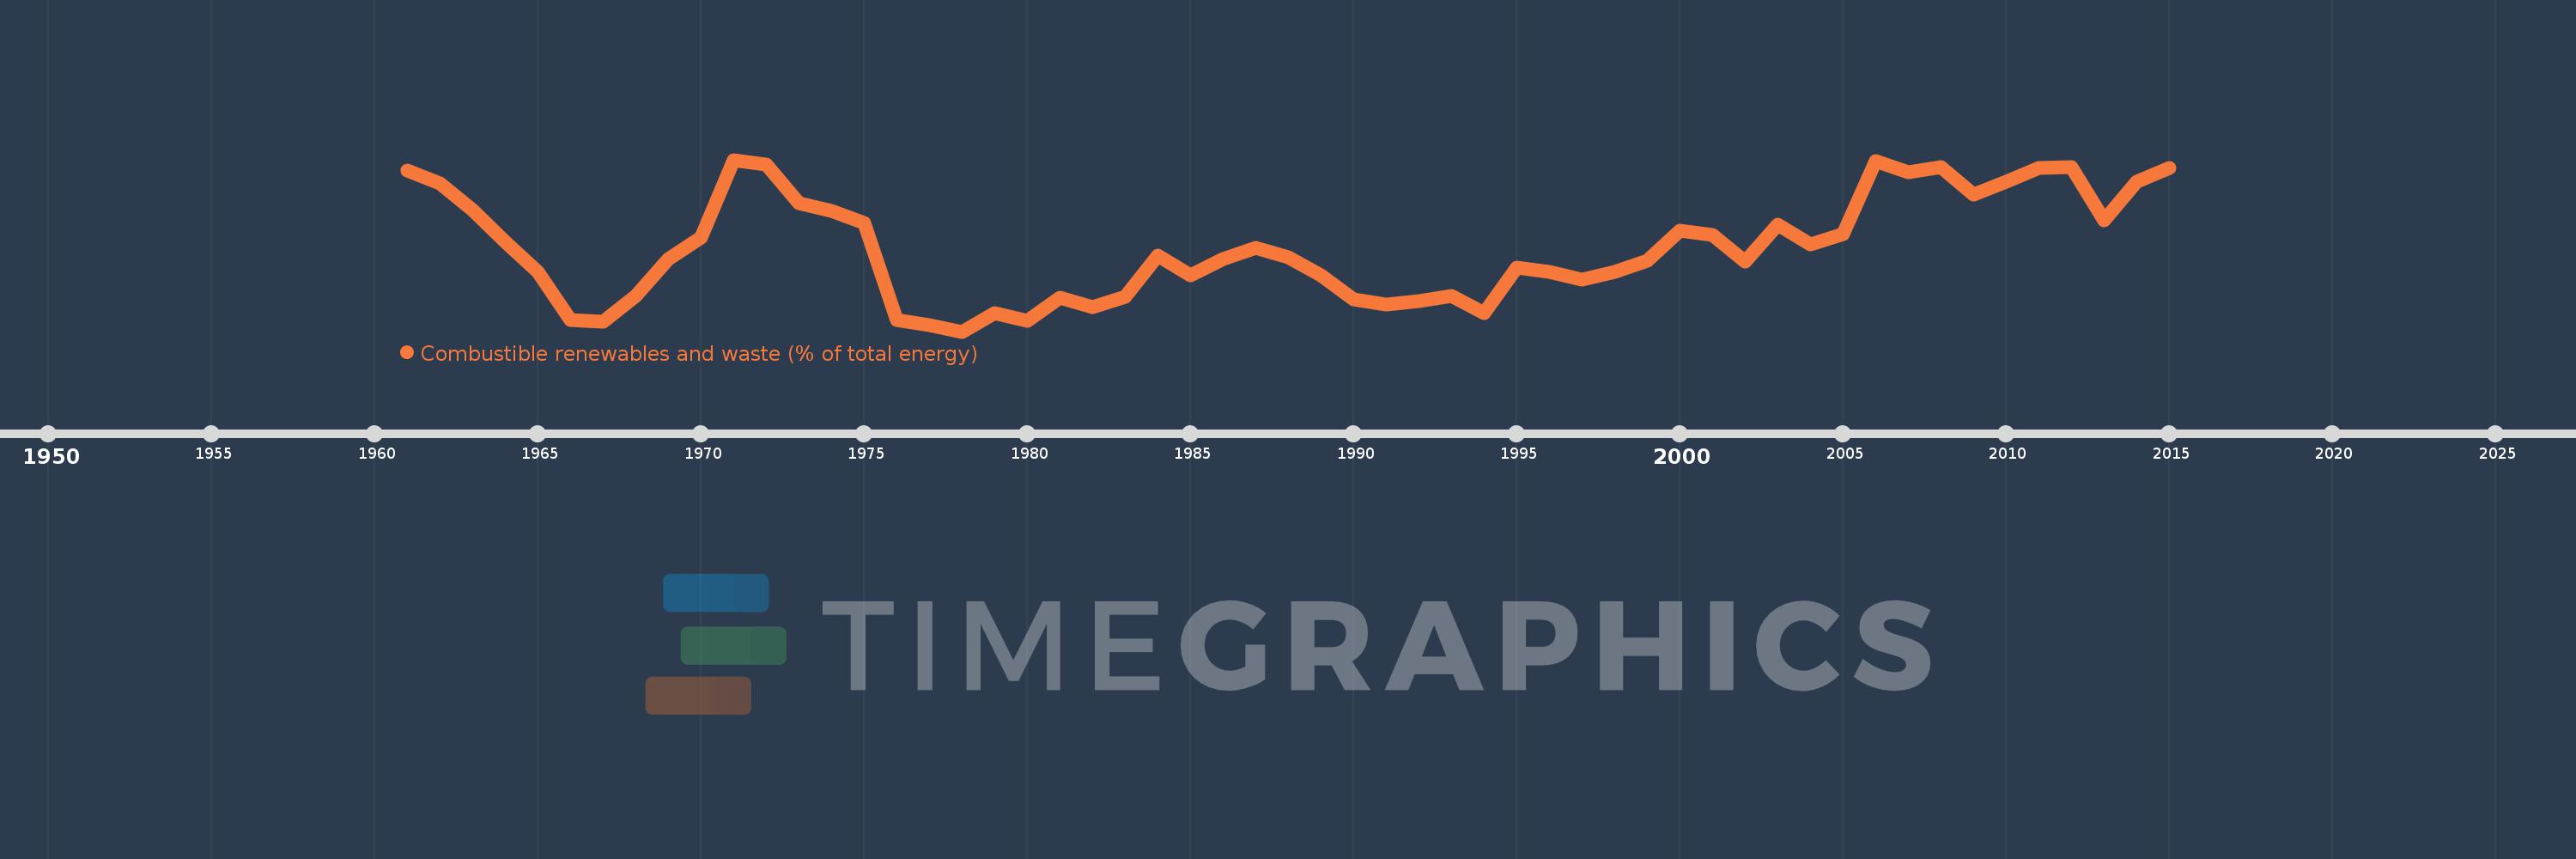
Combustible renewables and waste (% of total energy)
2015,2014,2013,2012,2011,2010,2009,2008,2007,2006,2005,2004,2003,2002,2001,2000,1999,1998,1997,1996,1995,1994,1993,1992,1991,1990,1989,1988,1987,1986,1985,1984,1983,1982,1981,1980,1979,1978,1977,1976,1975,1974,1973,1972,1971,1970,1969,1968,1967,1966,1965,1964,1963,1962,1961
This statistics in other country:
AlbaniaAlgeriaAngolaArab WorldArgentinaArmeniaAustraliaAustriaAzerbaijanBahrainBangladeshBelarusBelgiumBeninBoliviaBosnia and HerzegovinaBotswanaBrazilBrunei DarussalamBulgariaCambodiaCameroonCanadaCaribbean small statesCentral Europe and the BalticsChileChinaColombiaCongo, Dem. Rep.Congo, Rep.Costa RicaCote d'IvoireCroatiaCubaCuracaoCyprusCzech RepublicDenmarkDominican RepublicEarly-demographic dividendEast Asia & PacificEast Asia & Pacific (excluding high income)East Asia & Pacific (IDA & IBRD countries)EcuadorEgypt, Arab Rep.El SalvadorEritreaEstoniaEthiopiaEuro areaEurope & Central AsiaEurope & Central Asia (excluding high income)Europe & Central Asia (IDA & IBRD countries)European UnionFinlandFragile and conflict affected situationsFranceGabonGeorgiaGermanyGhanaGibraltarGreeceGuatemalaHaitiHeavily indebted poor countries (HIPC)High incomeHondurasHong Kong SAR, ChinaHungaryIBRD onlyIcelandIDA & IBRD totalIDA blendIDA onlyIDA totalIndiaIndonesiaIran, Islamic Rep.IraqIrelandIsraelItalyJamaicaJapanJordanKazakhstanKenyaKorea, Dem. People’s Rep.Korea, Rep.KosovoKuwaitKyrgyz RepublicLate-demographic dividendLatin America & Caribbean Latin America & Caribbean (excluding high income)Latin America & the Caribbean (IDA & IBRD countries)LatviaLeast developed countries: UN classificationLebanonLibyaLithuaniaLow & middle incomeLow incomeLower middle incomeLuxembourgMacedonia, FYRMalaysiaMaltaMauritiusMexicoMiddle East & North AfricaMiddle East & North Africa (excluding high income)Middle East & North Africa (IDA & IBRD countries)Middle incomeMoldovaMongoliaMontenegroMoroccoMozambiqueMyanmarNamibiaNepalNetherlandsNew ZealandNicaraguaNigerNigeriaNorth AmericaNorwayOECD membersOmanOther small statesPakistanPanamaParaguayPeruPhilippinesPolandPortugalPost-demographic dividendPre-demographic dividendQatarRomaniaRussian FederationSaudi ArabiaSenegalSerbiaSingaporeSlovak RepublicSloveniaSmall statesSouth AfricaSouth AsiaSouth Asia (IDA & IBRD)South SudanSpainSri LankaSub-Saharan Africa Sub-Saharan Africa (excluding high income)Sub-Saharan Africa (IDA & IBRD countries)SudanSwedenSwitzerlandSyrian Arab RepublicTajikistanTanzaniaThailandTogoTrinidad and TobagoTunisiaTurkeyTurkmenistanUkraineUnited Arab EmiratesUnited KingdomUnited StatesUpper middle incomeUruguayUzbekistanVenezuela, RBVietnamWorldYemen, Rep.ZambiaZimbabwe Timeline:
This timeline shows a graph from 1961 to 2015 of Canada. No data until 1960. Number of actual observations by date: 55.
Source name:
World Development Indicators
Source organization:
IEA Statistics © OECD/IEA 2014 (http://www.iea.org/stats/index.asp), subject to https://www.iea.org/t&c/termsandconditions/
Categories, topics:
Energy & Mining
Last updated:
apr 23, 2017
Indicators value changes by year
At the date of observation
Value
Absolute change
Change from previous value
jan 1, 1961
5.328
+5.328
0.0%
jan 1, 1962
5.194
-0.133
-2.5%
jan 1, 1963
4.91
-0.284
-5.47%
jan 1, 1964
4.576
-0.335
-6.81%
jan 1, 1965
4.256
-0.32
-7.0%
jan 1, 1966
3.748
-0.507
-11.92%
jan 1, 1967
3.73
-0.018
-0.48%
jan 1, 1968
4.0
+0.269
7.22%
jan 1, 1969
4.396
+0.396
9.91%
jan 1, 1970
4.623
+0.227
5.17%
jan 1, 1971
5.443
+0.82
17.73%
jan 1, 1972
5.393
-0.05
-0.91%
jan 1, 1973
4.988
-0.405
-7.52%
jan 1, 1974
4.904
-0.084
-1.69%
jan 1, 1975
4.779
-0.125
-2.55%
jan 1, 1976
3.749
-1.03
-21.55%
jan 1, 1977
3.699
-0.05
-1.33%
jan 1, 1978
3.627
-0.072
-1.94%
jan 1, 1979
3.821
+0.193
5.33%
jan 1, 1980
3.737
-0.084
-2.21%
jan 1, 1981
3.984
+0.248
6.63%
jan 1, 1982
3.885
-0.099
-2.48%
jan 1, 1983
3.999
+0.114
2.94%
jan 1, 1984
4.429
+0.43
10.75%
jan 1, 1985
4.225
-0.205
-4.62%
jan 1, 1986
4.392
+0.167
3.96%
jan 1, 1987
4.514
+0.122
2.77%
jan 1, 1988
4.413
-0.101
-2.23%
jan 1, 1989
4.226
-0.187
-4.24%
jan 1, 1990
3.963
-0.263
-6.21%
jan 1, 1991
3.911
-0.052
-1.32%
jan 1, 1992
3.952
+0.041
1.04%
jan 1, 1993
4.001
+0.049
1.24%
jan 1, 1994
3.818
-0.183
-4.56%
jan 1, 1995
4.302
+0.484
12.68%
jan 1, 1996
4.256
-0.047
-1.08%
jan 1, 1997
4.174
-0.082
-1.92%
jan 1, 1998
4.258
+0.084
2.01%
jan 1, 1999
4.373
+0.115
2.71%
jan 1, 2000
4.694
+0.321
7.33%
jan 1, 2001
4.647
-0.047
-0.99%
jan 1, 2002
4.37
-0.278
-5.97%
jan 1, 2003
4.756
+0.386
8.84%
jan 1, 2004
4.55
-0.206
-4.32%
jan 1, 2005
4.659
+0.108
2.37%
jan 1, 2006
5.432
+0.773
16.6%
jan 1, 2007
5.311
-0.121
-2.23%
jan 1, 2008
5.366
+0.055
1.04%
jan 1, 2009
5.071
-0.295
-5.5%
jan 1, 2010
5.209
+0.138
2.72%
jan 1, 2011
5.355
+0.146
2.8%
jan 1, 2012
5.37
+0.016
0.29%
jan 1, 2013
4.805
-0.566
-10.53%
jan 1, 2014
5.207
+0.402
8.37%
jan 1, 2015
5.36
+0.154
2.95%
Ranking of countries by current statistics by years


Comments: