29
/
en
AIzaSyAYiBZKx7MnpbEhh9jyipgxe19OcubqV5w
April 1, 2024
106998
Colombia
COL
true
2
1
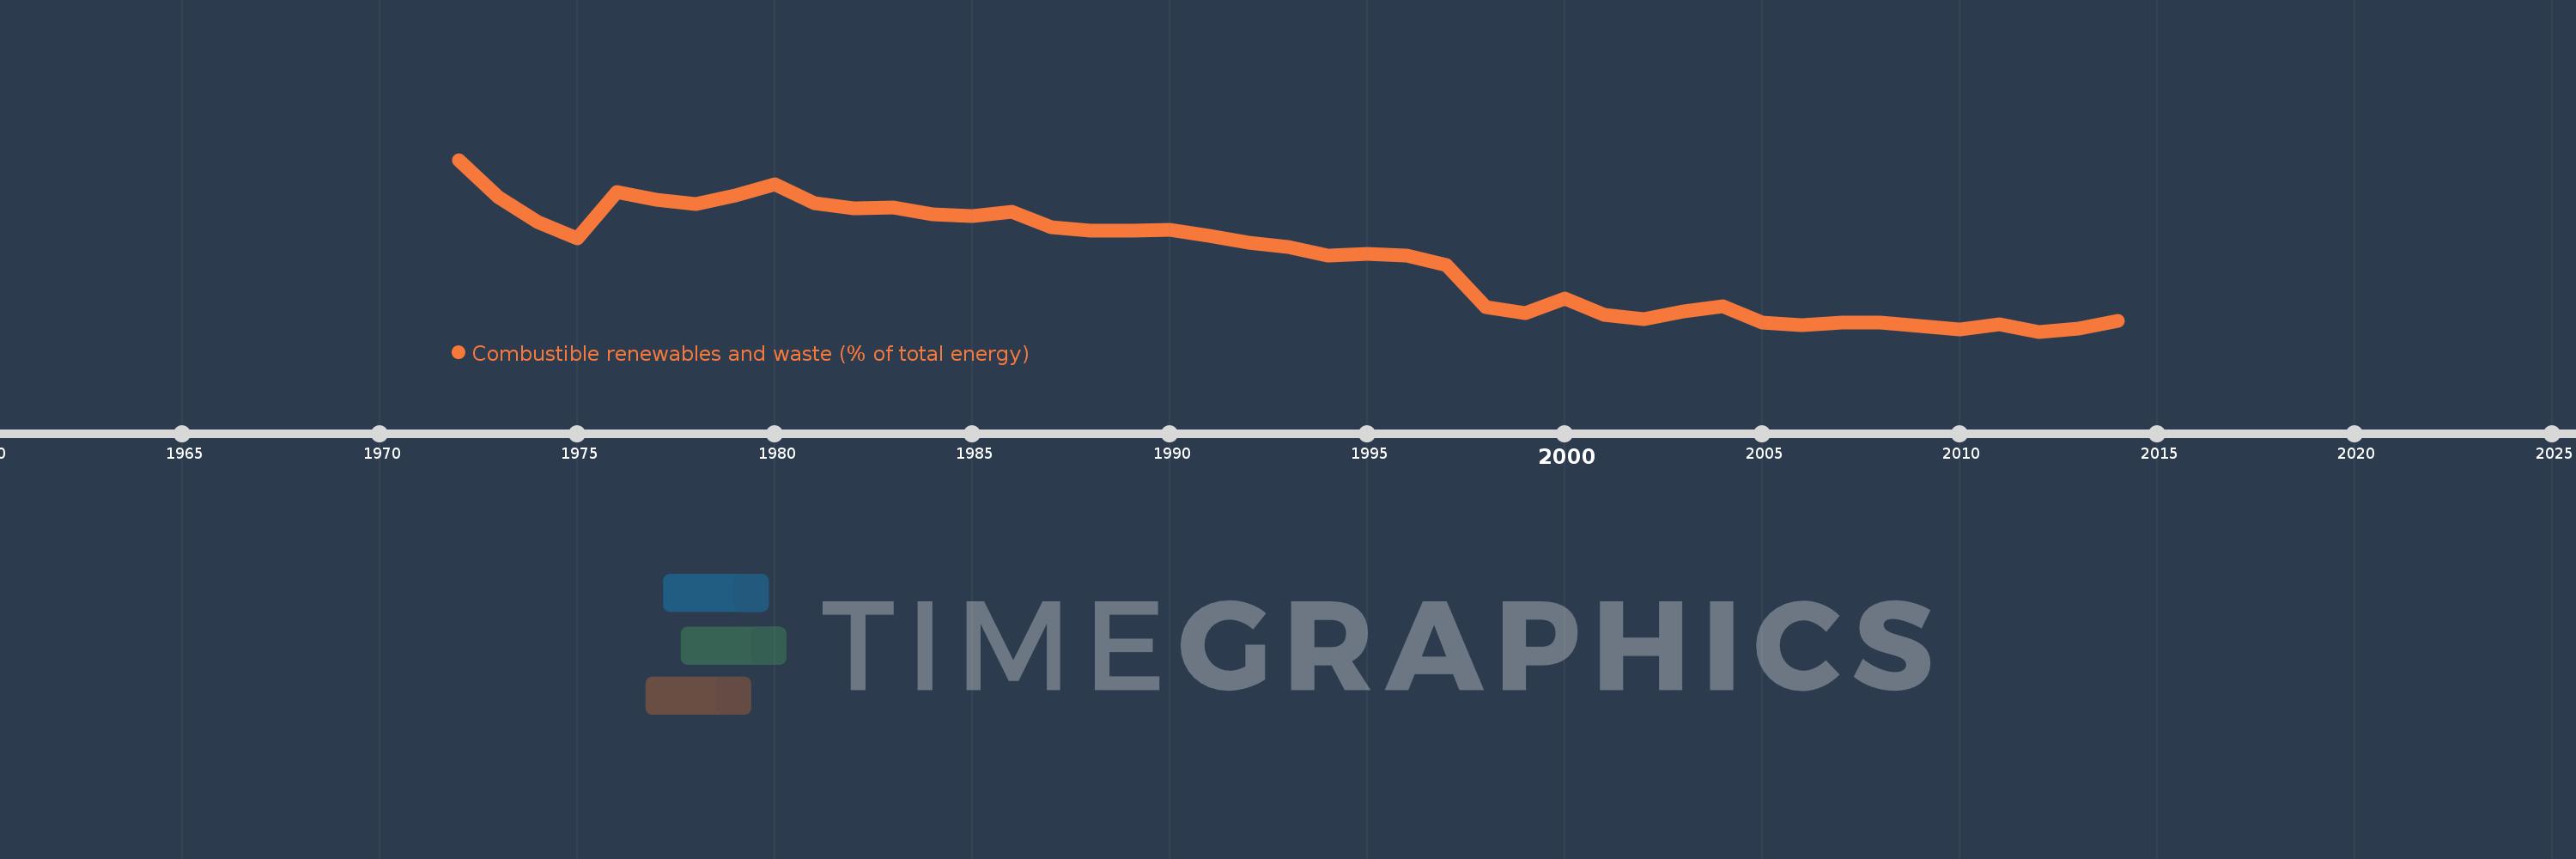
Combustible renewables and waste (% of total energy)
2014,2013,2012,2011,2010,2009,2008,2007,2006,2005,2004,2003,2002,2001,2000,1999,1998,1997,1996,1995,1994,1993,1992,1991,1990,1989,1988,1987,1986,1985,1984,1983,1982,1981,1980,1979,1978,1977,1976,1975,1974,1973,1972
This statistics in other country:
AlbaniaAlgeriaAngolaArab WorldArgentinaArmeniaAustraliaAustriaAzerbaijanBahrainBangladeshBelarusBelgiumBeninBoliviaBosnia and HerzegovinaBotswanaBrazilBrunei DarussalamBulgariaCambodiaCameroonCanadaCaribbean small statesCentral Europe and the BalticsChileChinaColombiaCongo, Dem. Rep.Congo, Rep.Costa RicaCote d'IvoireCroatiaCubaCuracaoCyprusCzech RepublicDenmarkDominican RepublicEarly-demographic dividendEast Asia & PacificEast Asia & Pacific (excluding high income)East Asia & Pacific (IDA & IBRD countries)EcuadorEgypt, Arab Rep.El SalvadorEritreaEstoniaEthiopiaEuro areaEurope & Central AsiaEurope & Central Asia (excluding high income)Europe & Central Asia (IDA & IBRD countries)European UnionFinlandFragile and conflict affected situationsFranceGabonGeorgiaGermanyGhanaGibraltarGreeceGuatemalaHaitiHeavily indebted poor countries (HIPC)High incomeHondurasHong Kong SAR, ChinaHungaryIBRD onlyIcelandIDA & IBRD totalIDA blendIDA onlyIDA totalIndiaIndonesiaIran, Islamic Rep.IraqIrelandIsraelItalyJamaicaJapanJordanKazakhstanKenyaKorea, Dem. People’s Rep.Korea, Rep.KosovoKuwaitKyrgyz RepublicLate-demographic dividendLatin America & Caribbean Latin America & Caribbean (excluding high income)Latin America & the Caribbean (IDA & IBRD countries)LatviaLeast developed countries: UN classificationLebanonLibyaLithuaniaLow & middle incomeLow incomeLower middle incomeLuxembourgMacedonia, FYRMalaysiaMaltaMauritiusMexicoMiddle East & North AfricaMiddle East & North Africa (excluding high income)Middle East & North Africa (IDA & IBRD countries)Middle incomeMoldovaMongoliaMontenegroMoroccoMozambiqueMyanmarNamibiaNepalNetherlandsNew ZealandNicaraguaNigerNigeriaNorth AmericaNorwayOECD membersOmanOther small statesPakistanPanamaParaguayPeruPhilippinesPolandPortugalPost-demographic dividendPre-demographic dividendQatarRomaniaRussian FederationSaudi ArabiaSenegalSerbiaSingaporeSlovak RepublicSloveniaSmall statesSouth AfricaSouth AsiaSouth Asia (IDA & IBRD)South SudanSpainSri LankaSub-Saharan Africa Sub-Saharan Africa (excluding high income)Sub-Saharan Africa (IDA & IBRD countries)SudanSwedenSwitzerlandSyrian Arab RepublicTajikistanTanzaniaThailandTogoTrinidad and TobagoTunisiaTurkeyTurkmenistanUkraineUnited Arab EmiratesUnited KingdomUnited StatesUpper middle incomeUruguayUzbekistanVenezuela, RBVietnamWorldYemen, Rep.ZambiaZimbabwe Timeline:
This timeline shows a graph from 1972 to 2014 of Colombia. No data until 1971. Number of actual observations by date: 43.
Source name:
World Development Indicators
Source organization:
IEA Statistics © OECD/IEA 2014 (http://www.iea.org/stats/index.asp), subject to https://www.iea.org/t&c/termsandconditions/
Categories, topics:
Energy & Mining
Last updated:
apr 23, 2017
Indicators value changes by year
Minimum:
11.242
jan 1, 2012
Maximum:
31.925
jan 1, 1972
At the date of observation
Value
Absolute change
Change from previous value
jan 1, 1972
31.925
+31.925
0.0%
jan 1, 1973
27.424
-4.501
-14.1%
jan 1, 1974
24.398
-3.026
-11.03%
jan 1, 1975
22.453
-1.945
-7.97%
jan 1, 1976
28.043
+5.589
24.89%
jan 1, 1977
27.076
-0.967
-3.45%
jan 1, 1978
26.562
-0.514
-1.9%
jan 1, 1979
27.667
+1.105
4.16%
jan 1, 1980
28.926
+1.259
4.55%
jan 1, 1981
26.728
-2.198
-7.6%
jan 1, 1982
26.115
-0.613
-2.29%
jan 1, 1983
26.182
+0.067
0.26%
jan 1, 1984
25.335
-0.847
-3.24%
jan 1, 1985
25.201
-0.134
-0.53%
jan 1, 1986
25.621
+0.42
1.67%
jan 1, 1987
23.789
-1.832
-7.15%
jan 1, 1988
23.427
-0.362
-1.52%
jan 1, 1989
23.417
-0.011
-0.05%
jan 1, 1990
23.523
+0.106
0.45%
jan 1, 1991
22.787
-0.736
-3.13%
jan 1, 1992
21.967
-0.82
-3.6%
jan 1, 1993
21.421
-0.545
-2.48%
jan 1, 1994
20.395
-1.026
-4.79%
jan 1, 1995
20.566
+0.171
0.84%
jan 1, 1996
20.353
-0.213
-1.04%
jan 1, 1997
19.251
-1.102
-5.42%
jan 1, 1998
14.22
-5.031
-26.14%
jan 1, 1999
13.517
-0.703
-4.94%
jan 1, 2000
15.174
+1.657
12.26%
jan 1, 2001
13.287
-1.887
-12.44%
jan 1, 2002
12.743
-0.544
-4.09%
jan 1, 2003
13.67
+0.927
7.27%
jan 1, 2004
14.31
+0.64
4.68%
jan 1, 2005
12.341
-1.969
-13.76%
jan 1, 2006
11.976
-0.365
-2.96%
jan 1, 2007
12.33
+0.354
2.95%
jan 1, 2008
12.318
-0.011
-0.09%
jan 1, 2009
11.938
-0.38
-3.09%
jan 1, 2010
11.474
-0.464
-3.88%
jan 1, 2011
12.118
+0.644
5.61%
jan 1, 2012
11.242
-0.876
-7.23%
jan 1, 2013
11.64
+0.397
3.53%
jan 1, 2014
12.512
+0.873
7.5%
Ranking of countries by current statistics by years


Comments: