29
/
en
AIzaSyAYiBZKx7MnpbEhh9jyipgxe19OcubqV5w
April 1, 2024
37214
IDA & IBRD total
IBT
false
2
1
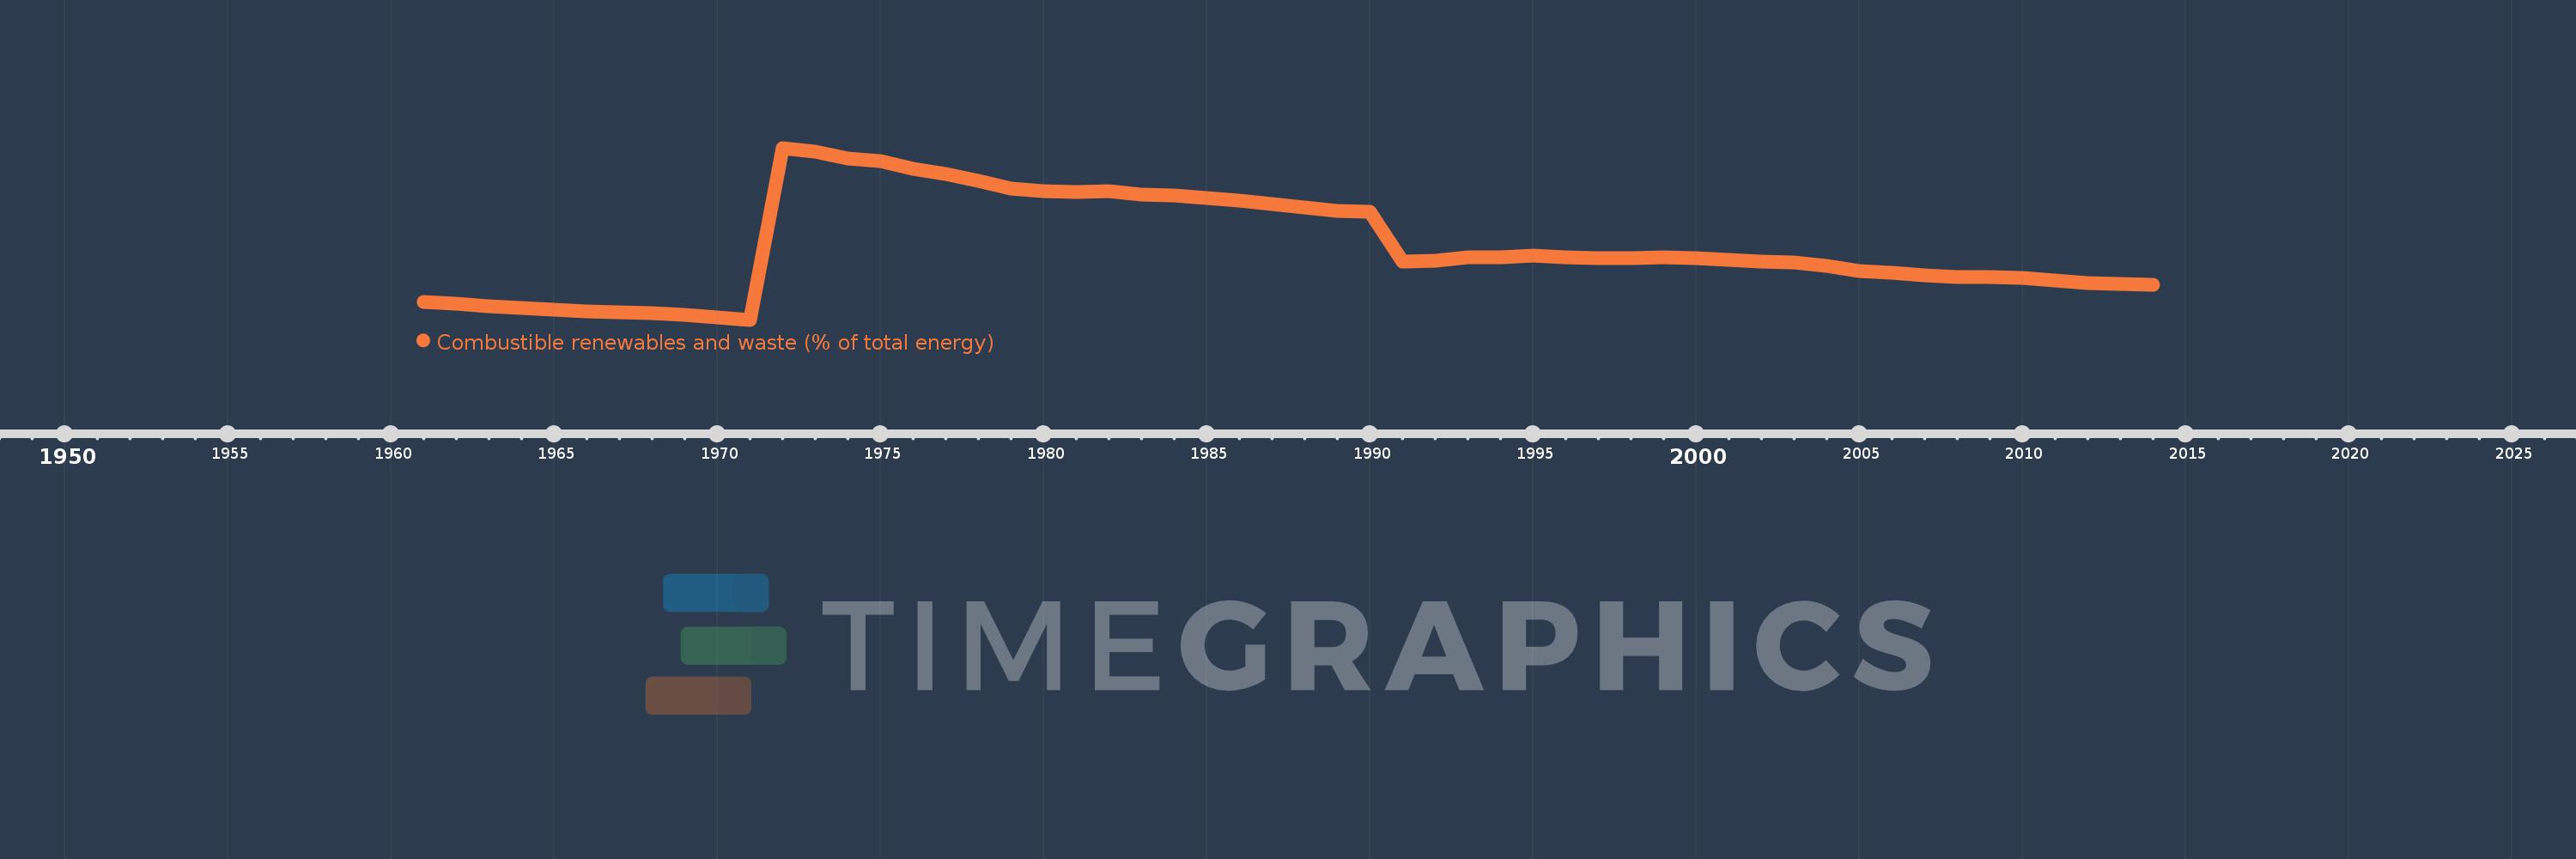
Combustible renewables and waste (% of total energy)
2014,2013,2012,2011,2010,2009,2008,2007,2006,2005,2004,2003,2002,2001,2000,1999,1998,1997,1996,1995,1994,1993,1992,1991,1990,1989,1988,1987,1986,1985,1984,1983,1982,1981,1980,1979,1978,1977,1976,1975,1974,1973,1972,1971,1970,1969,1968,1967,1966,1965,1964,1963,1962,1961
This statistics in other country:
AlbaniaAlgeriaAngolaArab WorldArgentinaArmeniaAustraliaAustriaAzerbaijanBahrainBangladeshBelarusBelgiumBeninBoliviaBosnia and HerzegovinaBotswanaBrazilBrunei DarussalamBulgariaCambodiaCameroonCanadaCaribbean small statesCentral Europe and the BalticsChileChinaColombiaCongo, Dem. Rep.Congo, Rep.Costa RicaCote d'IvoireCroatiaCubaCuracaoCyprusCzech RepublicDenmarkDominican RepublicEarly-demographic dividendEast Asia & PacificEast Asia & Pacific (excluding high income)East Asia & Pacific (IDA & IBRD countries)EcuadorEgypt, Arab Rep.El SalvadorEritreaEstoniaEthiopiaEuro areaEurope & Central AsiaEurope & Central Asia (excluding high income)Europe & Central Asia (IDA & IBRD countries)European UnionFinlandFragile and conflict affected situationsFranceGabonGeorgiaGermanyGhanaGibraltarGreeceGuatemalaHaitiHeavily indebted poor countries (HIPC)High incomeHondurasHong Kong SAR, ChinaHungaryIBRD onlyIcelandIDA & IBRD totalIDA blendIDA onlyIDA totalIndiaIndonesiaIran, Islamic Rep.IraqIrelandIsraelItalyJamaicaJapanJordanKazakhstanKenyaKorea, Dem. People’s Rep.Korea, Rep.KosovoKuwaitKyrgyz RepublicLate-demographic dividendLatin America & Caribbean Latin America & Caribbean (excluding high income)Latin America & the Caribbean (IDA & IBRD countries)LatviaLeast developed countries: UN classificationLebanonLibyaLithuaniaLow & middle incomeLow incomeLower middle incomeLuxembourgMacedonia, FYRMalaysiaMaltaMauritiusMexicoMiddle East & North AfricaMiddle East & North Africa (excluding high income)Middle East & North Africa (IDA & IBRD countries)Middle incomeMoldovaMongoliaMontenegroMoroccoMozambiqueMyanmarNamibiaNepalNetherlandsNew ZealandNicaraguaNigerNigeriaNorth AmericaNorwayOECD membersOmanOther small statesPakistanPanamaParaguayPeruPhilippinesPolandPortugalPost-demographic dividendPre-demographic dividendQatarRomaniaRussian FederationSaudi ArabiaSenegalSerbiaSingaporeSlovak RepublicSloveniaSmall statesSouth AfricaSouth AsiaSouth Asia (IDA & IBRD)South SudanSpainSri LankaSub-Saharan Africa Sub-Saharan Africa (excluding high income)Sub-Saharan Africa (IDA & IBRD countries)SudanSwedenSwitzerlandSyrian Arab RepublicTajikistanTanzaniaThailandTogoTrinidad and TobagoTunisiaTurkeyTurkmenistanUkraineUnited Arab EmiratesUnited KingdomUnited StatesUpper middle incomeUruguayUzbekistanVenezuela, RBVietnamWorldYemen, Rep.ZambiaZimbabwe Timeline:
This timeline shows a graph from 1961 to 2014 of IDA & IBRD total. No data until 1960. Number of actual observations by date: 54.
Source name:
World Development Indicators
Source organization:
IEA Statistics © OECD/IEA 2014 (http://www.iea.org/stats/index.asp), subject to https://www.iea.org/t&c/termsandconditions/
Categories, topics:
Energy & Mining
Last updated:
apr 23, 2017
Indicators value changes by year
Maximum:
39.952
jan 1, 1972
At the date of observation
Value
Absolute change
Change from previous value
jan 1, 1961
10.404
+10.404
0.0%
jan 1, 1962
10.109
-0.294
-2.83%
jan 1, 1963
9.532
-0.577
-5.71%
jan 1, 1964
9.197
-0.335
-3.52%
jan 1, 1965
8.929
-0.268
-2.91%
jan 1, 1966
8.593
-0.336
-3.76%
jan 1, 1967
8.405
-0.188
-2.19%
jan 1, 1968
8.192
-0.213
-2.54%
jan 1, 1969
7.837
-0.355
-4.34%
jan 1, 1970
7.436
-0.4
-5.11%
jan 1, 1971
6.946
-0.49
-6.59%
jan 1, 1972
39.952
+33.006
475.15%
jan 1, 1973
39.191
-0.762
-1.91%
jan 1, 1974
37.969
-1.222
-3.12%
jan 1, 1975
37.35
-0.619
-1.63%
jan 1, 1976
35.974
-1.376
-3.69%
jan 1, 1977
34.983
-0.991
-2.75%
jan 1, 1978
33.592
-1.391
-3.98%
jan 1, 1979
32.223
-1.368
-4.07%
jan 1, 1980
31.729
-0.494
-1.53%
jan 1, 1981
31.516
-0.214
-0.67%
jan 1, 1982
31.603
+0.087
0.28%
jan 1, 1983
30.959
-0.643
-2.04%
jan 1, 1984
30.821
-0.139
-0.45%
jan 1, 1985
30.28
-0.541
-1.76%
jan 1, 1986
29.814
-0.466
-1.54%
jan 1, 1987
29.231
-0.583
-1.95%
jan 1, 1988
28.536
-0.695
-2.38%
jan 1, 1989
27.897
-0.639
-2.24%
jan 1, 1990
27.726
-0.171
-0.61%
jan 1, 1991
18.101
-9.625
-34.71%
jan 1, 1992
18.35
+0.249
1.37%
jan 1, 1993
18.897
+0.547
2.98%
jan 1, 1994
19.001
+0.104
0.55%
jan 1, 1995
19.341
+0.34
1.79%
jan 1, 1996
18.996
-0.344
-1.78%
jan 1, 1997
18.797
-0.199
-1.05%
jan 1, 1998
18.81
+0.012
0.07%
jan 1, 1999
18.908
+0.098
0.52%
jan 1, 2000
18.771
-0.137
-0.72%
jan 1, 2001
18.377
-0.394
-2.1%
jan 1, 2002
18.199
-0.179
-0.97%
jan 1, 2003
17.977
-0.222
-1.22%
jan 1, 2004
17.242
-0.735
-4.09%
jan 1, 2005
16.382
-0.86
-4.99%
jan 1, 2006
15.96
-0.422
-2.57%
jan 1, 2007
15.46
-0.5
-3.13%
jan 1, 2008
15.224
-0.236
-1.53%
jan 1, 2009
15.098
-0.126
-0.83%
jan 1, 2010
14.986
-0.112
-0.74%
jan 1, 2011
14.473
-0.513
-3.42%
jan 1, 2012
14.055
-0.418
-2.89%
jan 1, 2013
13.845
-0.21
-1.49%
jan 1, 2014
13.618
-0.227
-1.64%
Ranking of countries by current statistics by years


Comments: