29
/
en
AIzaSyAYiBZKx7MnpbEhh9jyipgxe19OcubqV5w
April 1, 2024
31580
Europe & Central Asia (excluding high income)
ECA
false
2
1
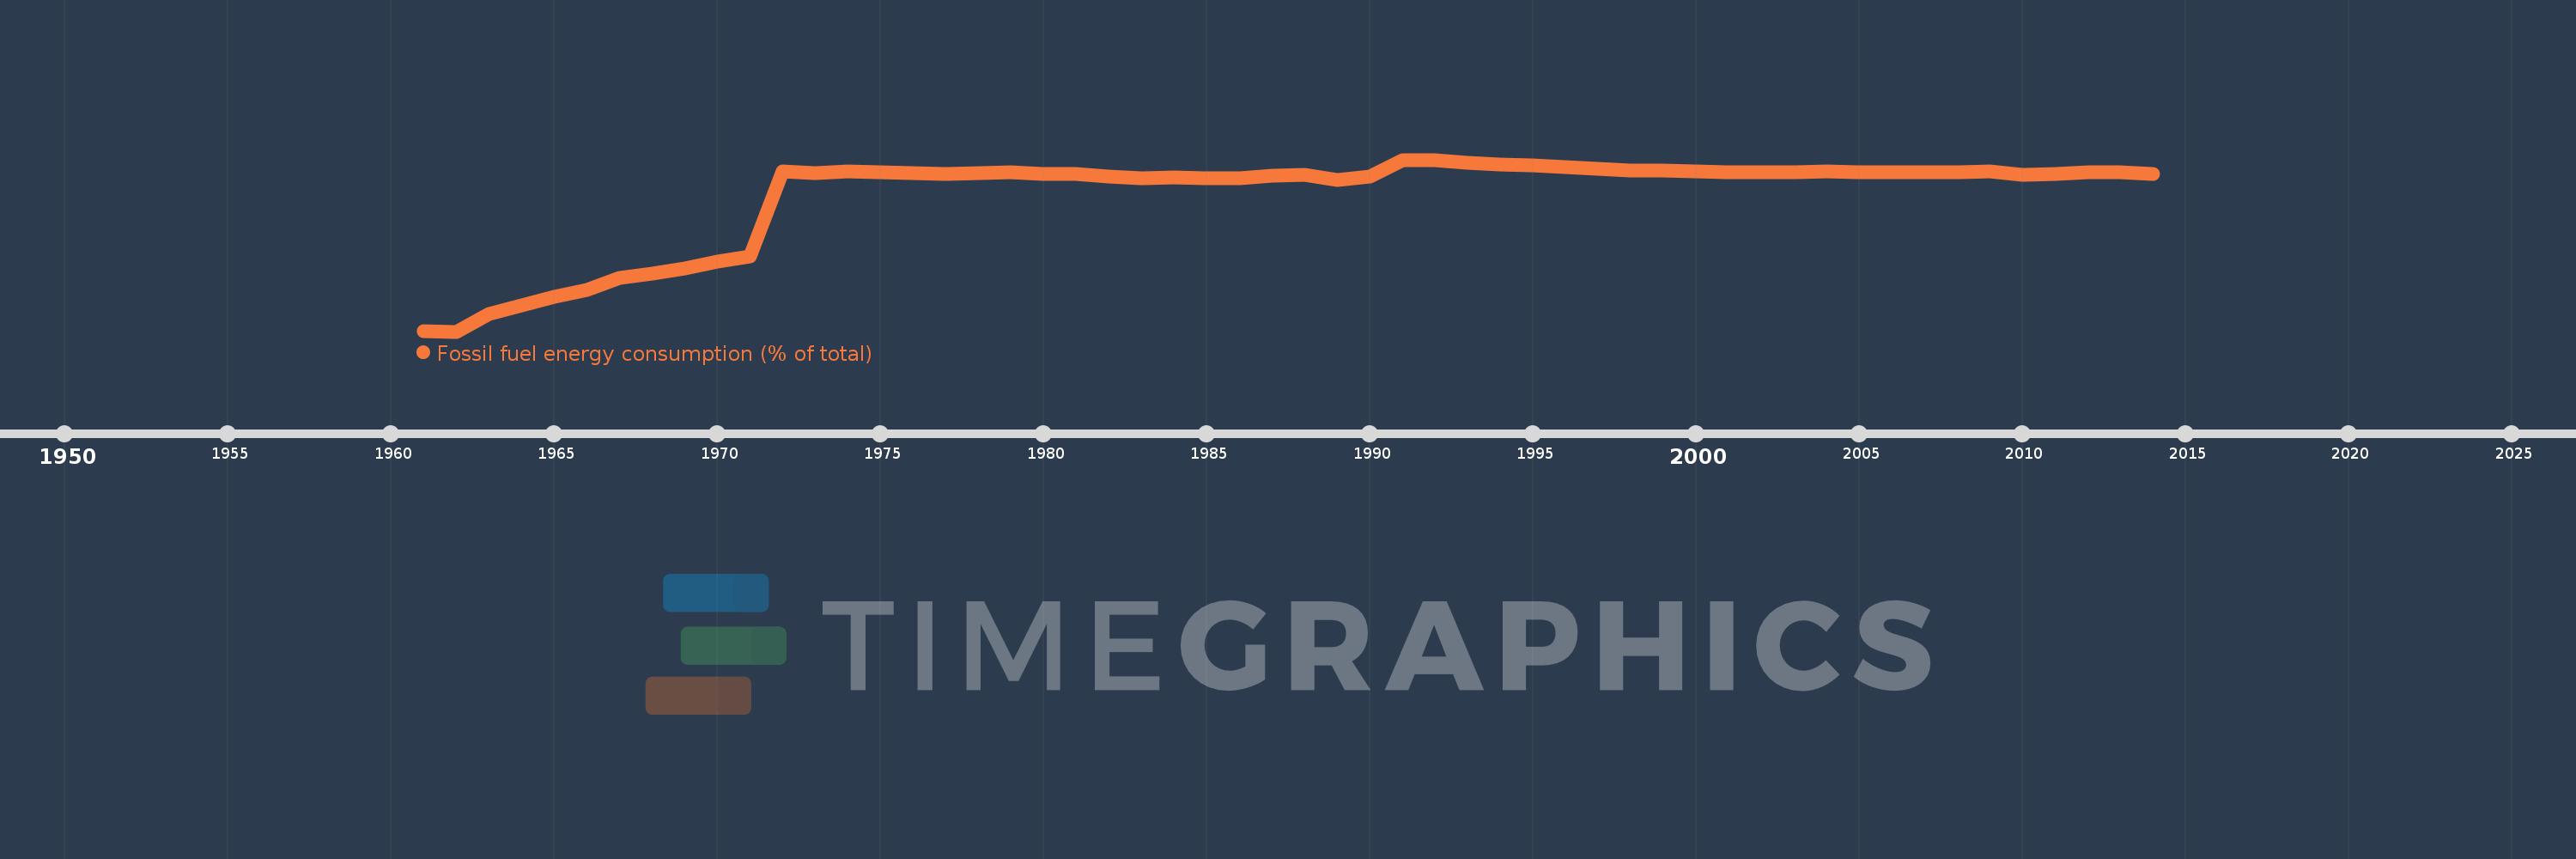
Fossil fuel energy consumption (% of total)
2014,2013,2012,2011,2010,2009,2008,2007,2006,2005,2004,2003,2002,2001,2000,1999,1998,1997,1996,1995,1994,1993,1992,1991,1990,1989,1988,1987,1986,1985,1984,1983,1982,1981,1980,1979,1978,1977,1976,1975,1974,1973,1972,1971,1970,1969,1968,1967,1966,1965,1964,1963,1962,1961
This statistics in other country:
AlbaniaAlgeriaAngolaAntigua and BarbudaArab WorldArgentinaArmeniaAustraliaAustriaAzerbaijanBahamas, TheBahrainBangladeshBarbadosBelarusBelgiumBelizeBeninBhutanBoliviaBosnia and HerzegovinaBotswanaBrazilBrunei DarussalamBulgariaCabo VerdeCambodiaCameroonCanadaCaribbean small statesCentral Europe and the BalticsChileChinaColombiaComorosCongo, Dem. Rep.Congo, Rep.Costa RicaCote d'IvoireCroatiaCubaCuracaoCyprusCzech RepublicDenmarkDjiboutiDominicaDominican RepublicEarly-demographic dividendEast Asia & PacificEast Asia & Pacific (excluding high income)East Asia & Pacific (IDA & IBRD countries)EcuadorEgypt, Arab Rep.El SalvadorEquatorial GuineaEritreaEstoniaEthiopiaEuro areaEurope & Central AsiaEurope & Central Asia (excluding high income)Europe & Central Asia (IDA & IBRD countries)European UnionFijiFinlandFragile and conflict affected situationsFranceGabonGambia, TheGeorgiaGermanyGhanaGibraltarGreeceGrenadaGuatemalaGuinea-BissauGuyanaHaitiHeavily indebted poor countries (HIPC)High incomeHondurasHong Kong SAR, ChinaHungaryIBRD onlyIcelandIDA & IBRD totalIDA blendIDA onlyIDA totalIndiaIndonesiaIran, Islamic Rep.IraqIrelandIsraelItalyJamaicaJapanJordanKazakhstanKenyaKiribatiKorea, Dem. People’s Rep.Korea, Rep.KosovoKuwaitKyrgyz RepublicLate-demographic dividendLatin America & Caribbean Latin America & Caribbean (excluding high income)Latin America & the Caribbean (IDA & IBRD countries)LatviaLeast developed countries: UN classificationLebanonLesothoLibyaLithuaniaLow & middle incomeLow incomeLower middle incomeLuxembourgMacedonia, FYRMalaysiaMaldivesMaltaMarshall IslandsMauritiusMexicoMiddle East & North AfricaMiddle East & North Africa (excluding high income)Middle East & North Africa (IDA & IBRD countries)Middle incomeMoldovaMongoliaMontenegroMoroccoMozambiqueMyanmarNamibiaNepalNetherlandsNew ZealandNicaraguaNigerNigeriaNorth AmericaNorwayOECD membersOmanOther small statesPacific island small statesPakistanPalauPanamaParaguayPeruPhilippinesPolandPortugalPost-demographic dividendPre-demographic dividendQatarRomaniaRussian FederationSamoaSao Tome and PrincipeSaudi ArabiaSenegalSerbiaSeychellesSingaporeSlovak RepublicSloveniaSmall statesSolomon IslandsSouth AfricaSouth AsiaSouth Asia (IDA & IBRD)South SudanSpainSri LankaSt. Kitts and NevisSt. LuciaSt. Vincent and the GrenadinesSub-Saharan Africa Sub-Saharan Africa (excluding high income)Sub-Saharan Africa (IDA & IBRD countries)SudanSurinameSwazilandSwedenSwitzerlandSyrian Arab RepublicTajikistanTanzaniaThailandTimor-LesteTogoTongaTrinidad and TobagoTunisiaTurkeyUkraineUnited Arab EmiratesUnited KingdomUnited StatesUpper middle incomeUruguayUzbekistanVanuatuVenezuela, RBVietnamWorldYemen, Rep.ZambiaZimbabwe Timeline:
This timeline shows a graph from 1961 to 2014 of Europe & Central Asia (excluding high income). No data until 1960. Number of actual observations by date: 54.
Source name:
World Development Indicators
Source organization:
IEA Statistics © OECD/IEA 2014 (http://www.iea.org/stats/index.asp), subject to https://www.iea.org/t&c/termsandconditions/
Categories, topics:
Energy & Mining
Last updated:
apr 23, 2017
Indicators value changes by year
Minimum:
44.159
jan 1, 1962
Maximum:
93.038
jan 1, 1991
At the date of observation
Value
Absolute change
Change from previous value
jan 1, 1961
44.199
+44.199
0.0%
jan 1, 1962
44.159
-0.04
-0.09%
jan 1, 1963
49.05
+4.891
11.07%
jan 1, 1964
51.626
+2.577
5.25%
jan 1, 1965
53.975
+2.349
4.55%
jan 1, 1966
56.082
+2.107
3.9%
jan 1, 1967
59.449
+3.367
6.0%
jan 1, 1968
60.625
+1.175
1.98%
jan 1, 1969
62.183
+1.559
2.57%
jan 1, 1970
64.161
+1.978
3.18%
jan 1, 1971
65.654
+1.493
2.33%
jan 1, 1972
89.724
+24.07
36.66%
jan 1, 1973
89.331
-0.393
-0.44%
jan 1, 1974
89.808
+0.477
0.53%
jan 1, 1975
89.502
-0.306
-0.34%
jan 1, 1976
89.261
-0.241
-0.27%
jan 1, 1977
89.064
-0.197
-0.22%
jan 1, 1978
89.227
+0.163
0.18%
jan 1, 1979
89.48
+0.253
0.28%
jan 1, 1980
89.095
-0.385
-0.43%
jan 1, 1981
89.115
+0.02
0.02%
jan 1, 1982
88.243
-0.872
-0.98%
jan 1, 1983
87.897
-0.346
-0.39%
jan 1, 1984
88.045
+0.149
0.17%
jan 1, 1985
87.876
-0.169
-0.19%
jan 1, 1986
87.885
+0.009
0.01%
jan 1, 1987
88.465
+0.579
0.66%
jan 1, 1988
88.701
+0.236
0.27%
jan 1, 1989
87.349
-1.351
-1.52%
jan 1, 1990
88.391
+1.041
1.19%
jan 1, 1991
93.038
+4.647
5.26%
jan 1, 1992
92.915
-0.123
-0.13%
jan 1, 1993
92.212
-0.703
-0.76%
jan 1, 1994
91.66
-0.552
-0.6%
jan 1, 1995
91.445
-0.215
-0.23%
jan 1, 1996
91.064
-0.38
-0.42%
jan 1, 1997
90.45
-0.614
-0.67%
jan 1, 1998
90.056
-0.394
-0.44%
jan 1, 1999
90.05
-0.006
-0.01%
jan 1, 2000
89.678
-0.371
-0.41%
jan 1, 2001
89.529
-0.15
-0.17%
jan 1, 2002
89.49
-0.039
-0.04%
jan 1, 2003
89.409
-0.081
-0.09%
jan 1, 2004
89.724
+0.315
0.35%
jan 1, 2005
89.471
-0.252
-0.28%
jan 1, 2006
89.383
-0.088
-0.1%
jan 1, 2007
89.454
+0.071
0.08%
jan 1, 2008
89.533
+0.079
0.09%
jan 1, 2009
89.692
+0.159
0.18%
jan 1, 2010
88.842
-0.85
-0.95%
jan 1, 2011
88.976
+0.134
0.15%
jan 1, 2012
89.53
+0.554
0.62%
jan 1, 2013
89.376
-0.154
-0.17%
jan 1, 2014
88.976
-0.4
-0.45%
Ranking of countries by current statistics by years


Comments: