29
/
en
AIzaSyAYiBZKx7MnpbEhh9jyipgxe19OcubqV5w
April 1, 2024
206738
Nepal
NPL
true
2
1
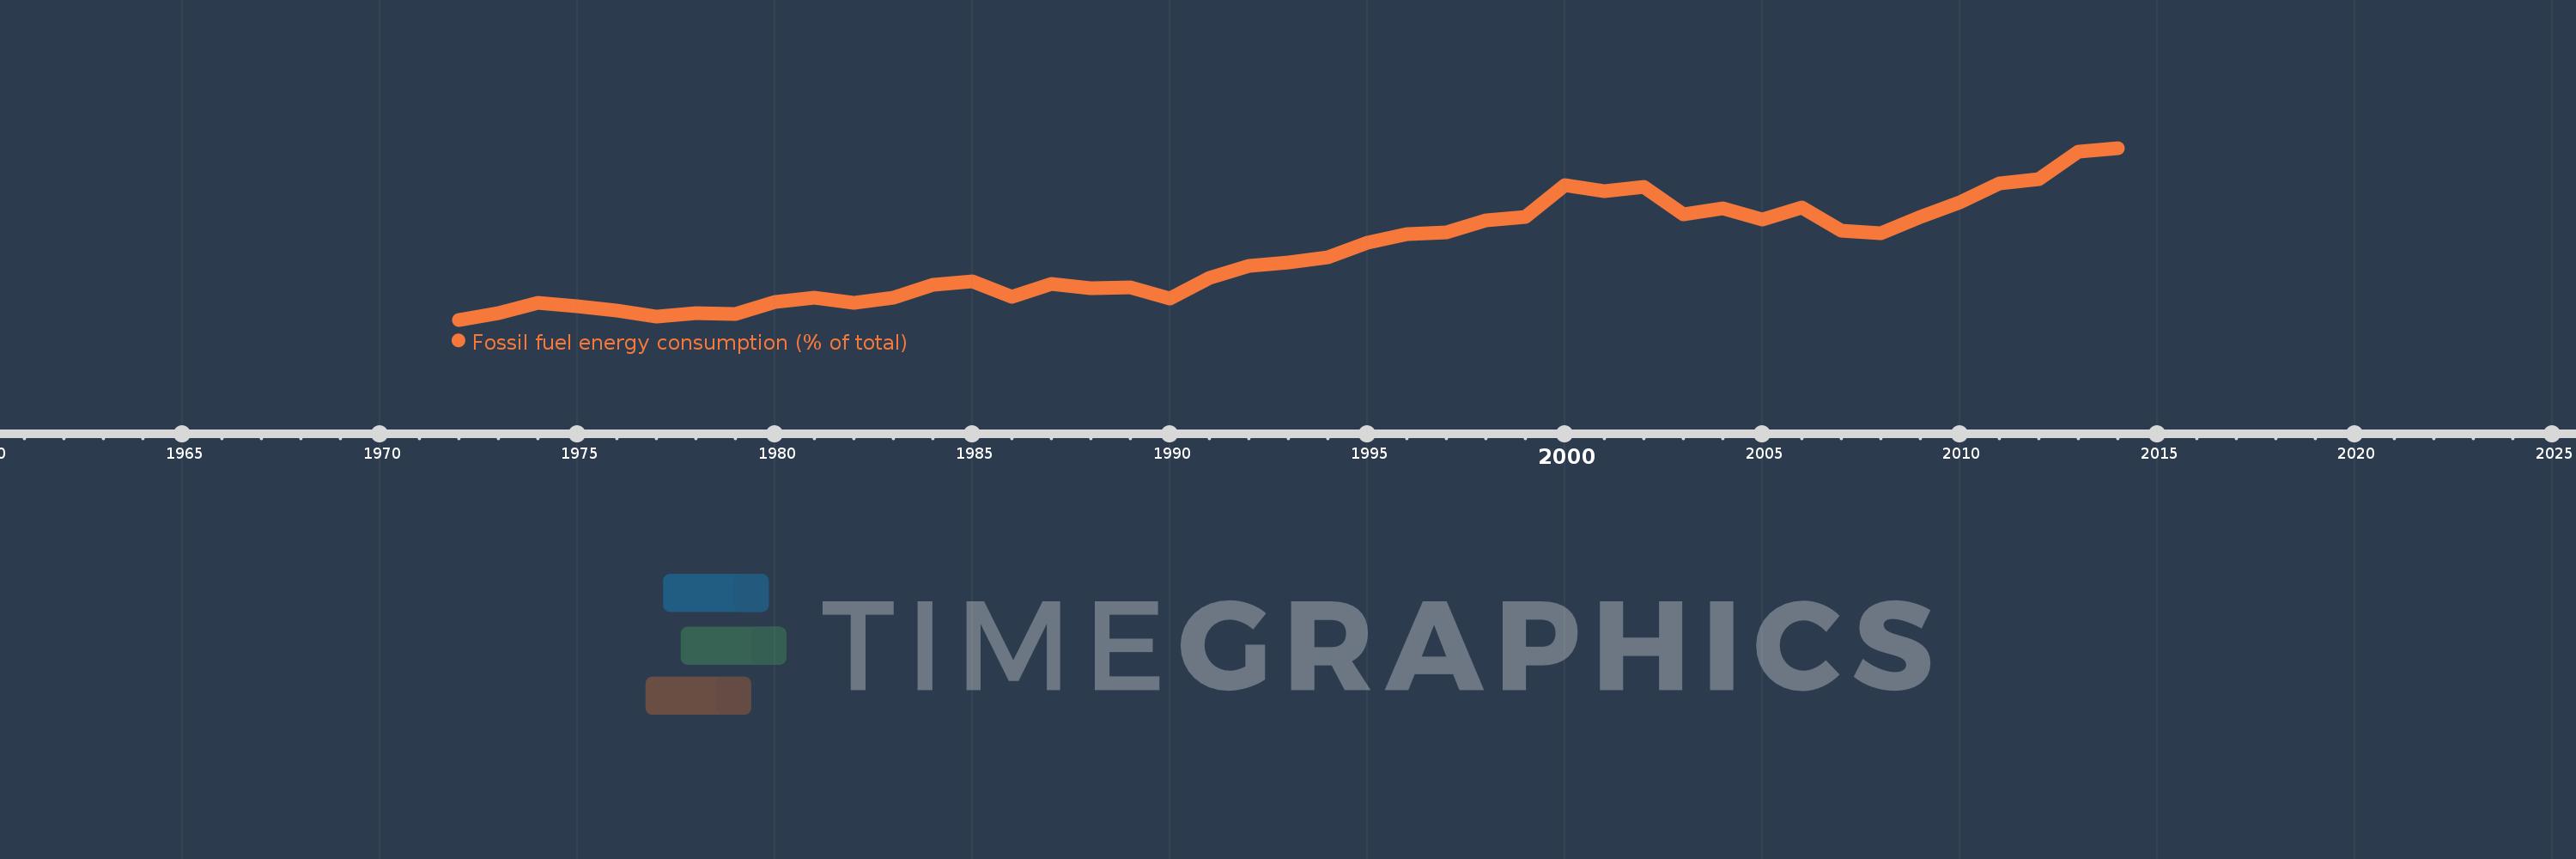
Fossil fuel energy consumption (% of total)
2014,2013,2012,2011,2010,2009,2008,2007,2006,2005,2004,2003,2002,2001,2000,1999,1998,1997,1996,1995,1994,1993,1992,1991,1990,1989,1988,1987,1986,1985,1984,1983,1982,1981,1980,1979,1978,1977,1976,1975,1974,1973,1972
This statistics in other country:
AlbaniaAlgeriaAngolaAntigua and BarbudaArab WorldArgentinaArmeniaAustraliaAustriaAzerbaijanBahamas, TheBahrainBangladeshBarbadosBelarusBelgiumBelizeBeninBhutanBoliviaBosnia and HerzegovinaBotswanaBrazilBrunei DarussalamBulgariaCabo VerdeCambodiaCameroonCanadaCaribbean small statesCentral Europe and the BalticsChileChinaColombiaComorosCongo, Dem. Rep.Congo, Rep.Costa RicaCote d'IvoireCroatiaCubaCuracaoCyprusCzech RepublicDenmarkDjiboutiDominicaDominican RepublicEarly-demographic dividendEast Asia & PacificEast Asia & Pacific (excluding high income)East Asia & Pacific (IDA & IBRD countries)EcuadorEgypt, Arab Rep.El SalvadorEquatorial GuineaEritreaEstoniaEthiopiaEuro areaEurope & Central AsiaEurope & Central Asia (excluding high income)Europe & Central Asia (IDA & IBRD countries)European UnionFijiFinlandFragile and conflict affected situationsFranceGabonGambia, TheGeorgiaGermanyGhanaGibraltarGreeceGrenadaGuatemalaGuinea-BissauGuyanaHaitiHeavily indebted poor countries (HIPC)High incomeHondurasHong Kong SAR, ChinaHungaryIBRD onlyIcelandIDA & IBRD totalIDA blendIDA onlyIDA totalIndiaIndonesiaIran, Islamic Rep.IraqIrelandIsraelItalyJamaicaJapanJordanKazakhstanKenyaKiribatiKorea, Dem. People’s Rep.Korea, Rep.KosovoKuwaitKyrgyz RepublicLate-demographic dividendLatin America & Caribbean Latin America & Caribbean (excluding high income)Latin America & the Caribbean (IDA & IBRD countries)LatviaLeast developed countries: UN classificationLebanonLesothoLibyaLithuaniaLow & middle incomeLow incomeLower middle incomeLuxembourgMacedonia, FYRMalaysiaMaldivesMaltaMarshall IslandsMauritiusMexicoMiddle East & North AfricaMiddle East & North Africa (excluding high income)Middle East & North Africa (IDA & IBRD countries)Middle incomeMoldovaMongoliaMontenegroMoroccoMozambiqueMyanmarNamibiaNepalNetherlandsNew ZealandNicaraguaNigerNigeriaNorth AmericaNorwayOECD membersOmanOther small statesPacific island small statesPakistanPalauPanamaParaguayPeruPhilippinesPolandPortugalPost-demographic dividendPre-demographic dividendQatarRomaniaRussian FederationSamoaSao Tome and PrincipeSaudi ArabiaSenegalSerbiaSeychellesSingaporeSlovak RepublicSloveniaSmall statesSolomon IslandsSouth AfricaSouth AsiaSouth Asia (IDA & IBRD)South SudanSpainSri LankaSt. Kitts and NevisSt. LuciaSt. Vincent and the GrenadinesSub-Saharan Africa Sub-Saharan Africa (excluding high income)Sub-Saharan Africa (IDA & IBRD countries)SudanSurinameSwazilandSwedenSwitzerlandSyrian Arab RepublicTajikistanTanzaniaThailandTimor-LesteTogoTongaTrinidad and TobagoTunisiaTurkeyUkraineUnited Arab EmiratesUnited KingdomUnited StatesUpper middle incomeUruguayUzbekistanVanuatuVenezuela, RBVietnamWorldYemen, Rep.ZambiaZimbabwe Timeline:
This timeline shows a graph from 1972 to 2014 of Nepal. No data until 1971. Number of actual observations by date: 43.
Source name:
World Development Indicators
Source organization:
IEA Statistics © OECD/IEA 2014 (http://www.iea.org/stats/index.asp), subject to https://www.iea.org/t&c/termsandconditions/
Categories, topics:
Energy & Mining
Last updated:
apr 23, 2017
Indicators value changes by year
Maximum:
15.465
jan 1, 2014
At the date of observation
Value
Absolute change
Change from previous value
jan 1, 1972
1.654
+1.654
0.0%
jan 1, 1973
2.163
+0.509
30.78%
jan 1, 1974
2.987
+0.824
38.09%
jan 1, 1975
2.745
-0.241
-8.08%
jan 1, 1976
2.409
-0.337
-12.27%
jan 1, 1977
1.92
-0.489
-20.3%
jan 1, 1978
2.167
+0.247
12.86%
jan 1, 1979
2.091
-0.075
-3.47%
jan 1, 1980
3.059
+0.967
46.25%
jan 1, 1981
3.457
+0.398
13.01%
jan 1, 1982
2.983
-0.474
-13.71%
jan 1, 1983
3.431
+0.449
15.04%
jan 1, 1984
4.449
+1.018
29.66%
jan 1, 1985
4.745
+0.296
6.66%
jan 1, 1986
3.504
-1.241
-26.15%
jan 1, 1987
4.503
+0.999
28.5%
jan 1, 1988
4.166
-0.337
-7.49%
jan 1, 1989
4.284
+0.118
2.82%
jan 1, 1990
3.373
-0.911
-21.27%
jan 1, 1991
5.051
+1.678
49.77%
jan 1, 1992
6.01
+0.959
18.98%
jan 1, 1993
6.287
+0.277
4.62%
jan 1, 1994
6.702
+0.415
6.59%
jan 1, 1995
7.854
+1.152
17.19%
jan 1, 1996
8.559
+0.705
8.97%
jan 1, 1997
8.669
+0.11
1.29%
jan 1, 1998
9.656
+0.987
11.39%
jan 1, 1999
9.93
+0.275
2.84%
jan 1, 2000
12.506
+2.576
25.94%
jan 1, 2001
11.974
-0.533
-4.26%
jan 1, 2002
12.352
+0.379
3.16%
jan 1, 2003
10.158
-2.195
-17.77%
jan 1, 2004
10.61
+0.452
4.45%
jan 1, 2005
9.705
-0.905
-8.53%
jan 1, 2006
10.647
+0.942
9.7%
jan 1, 2007
8.831
-1.816
-17.05%
jan 1, 2008
8.616
-0.215
-2.44%
jan 1, 2009
9.886
+1.27
14.75%
jan 1, 2010
11.093
+1.207
12.21%
jan 1, 2011
12.597
+1.504
13.56%
jan 1, 2012
12.987
+0.39
3.1%
jan 1, 2013
15.171
+2.185
16.82%
jan 1, 2014
15.465
+0.294
1.94%
Ranking of countries by current statistics by years


Comments: