29
/
en
AIzaSyAYiBZKx7MnpbEhh9jyipgxe19OcubqV5w
April 1, 2024
274757
United Arab Emirates
ARE
true
2
1
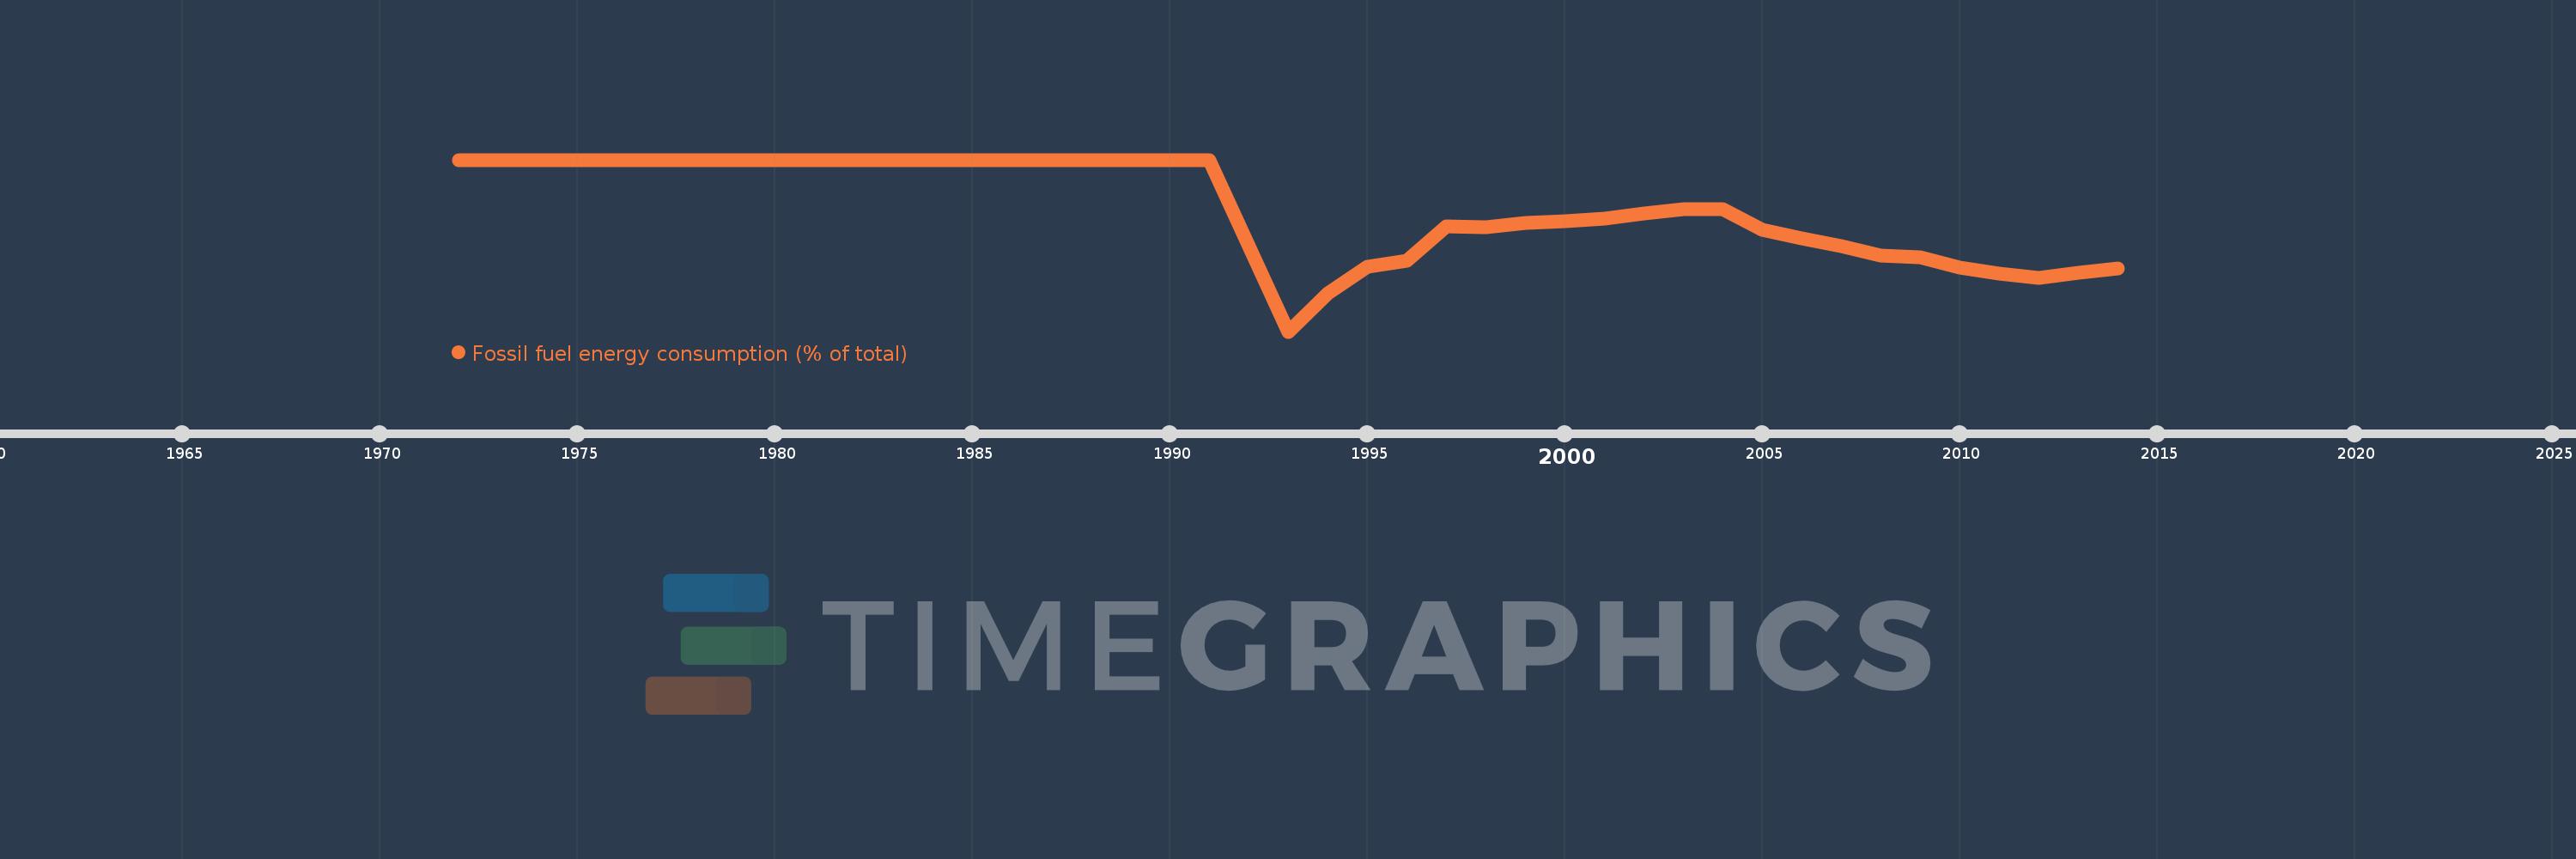
Fossil fuel energy consumption (% of total)
2014,2013,2012,2011,2010,2009,2008,2007,2006,2005,2004,2003,2002,2001,2000,1999,1998,1997,1996,1995,1994,1993,1991,1990,1989,1988,1987,1985,1984,1981,1980,1979,1978,1977,1976,1975,1974,1973,1972
This statistics in other country:
AlbaniaAlgeriaAngolaAntigua and BarbudaArab WorldArgentinaArmeniaAustraliaAustriaAzerbaijanBahamas, TheBahrainBangladeshBarbadosBelarusBelgiumBelizeBeninBhutanBoliviaBosnia and HerzegovinaBotswanaBrazilBrunei DarussalamBulgariaCabo VerdeCambodiaCameroonCanadaCaribbean small statesCentral Europe and the BalticsChileChinaColombiaComorosCongo, Dem. Rep.Congo, Rep.Costa RicaCote d'IvoireCroatiaCubaCuracaoCyprusCzech RepublicDenmarkDjiboutiDominicaDominican RepublicEarly-demographic dividendEast Asia & PacificEast Asia & Pacific (excluding high income)East Asia & Pacific (IDA & IBRD countries)EcuadorEgypt, Arab Rep.El SalvadorEquatorial GuineaEritreaEstoniaEthiopiaEuro areaEurope & Central AsiaEurope & Central Asia (excluding high income)Europe & Central Asia (IDA & IBRD countries)European UnionFijiFinlandFragile and conflict affected situationsFranceGabonGambia, TheGeorgiaGermanyGhanaGibraltarGreeceGrenadaGuatemalaGuinea-BissauGuyanaHaitiHeavily indebted poor countries (HIPC)High incomeHondurasHong Kong SAR, ChinaHungaryIBRD onlyIcelandIDA & IBRD totalIDA blendIDA onlyIDA totalIndiaIndonesiaIran, Islamic Rep.IraqIrelandIsraelItalyJamaicaJapanJordanKazakhstanKenyaKiribatiKorea, Dem. People’s Rep.Korea, Rep.KosovoKuwaitKyrgyz RepublicLate-demographic dividendLatin America & Caribbean Latin America & Caribbean (excluding high income)Latin America & the Caribbean (IDA & IBRD countries)LatviaLeast developed countries: UN classificationLebanonLesothoLibyaLithuaniaLow & middle incomeLow incomeLower middle incomeLuxembourgMacedonia, FYRMalaysiaMaldivesMaltaMarshall IslandsMauritiusMexicoMiddle East & North AfricaMiddle East & North Africa (excluding high income)Middle East & North Africa (IDA & IBRD countries)Middle incomeMoldovaMongoliaMontenegroMoroccoMozambiqueMyanmarNamibiaNepalNetherlandsNew ZealandNicaraguaNigerNigeriaNorth AmericaNorwayOECD membersOmanOther small statesPacific island small statesPakistanPalauPanamaParaguayPeruPhilippinesPolandPortugalPost-demographic dividendPre-demographic dividendQatarRomaniaRussian FederationSamoaSao Tome and PrincipeSaudi ArabiaSenegalSerbiaSeychellesSingaporeSlovak RepublicSloveniaSmall statesSolomon IslandsSouth AfricaSouth AsiaSouth Asia (IDA & IBRD)South SudanSpainSri LankaSt. Kitts and NevisSt. LuciaSt. Vincent and the GrenadinesSub-Saharan Africa Sub-Saharan Africa (excluding high income)Sub-Saharan Africa (IDA & IBRD countries)SudanSurinameSwazilandSwedenSwitzerlandSyrian Arab RepublicTajikistanTanzaniaThailandTimor-LesteTogoTongaTrinidad and TobagoTunisiaTurkeyUkraineUnited Arab EmiratesUnited KingdomUnited StatesUpper middle incomeUruguayUzbekistanVanuatuVenezuela, RBVietnamWorldYemen, Rep.ZambiaZimbabwe Timeline:
This timeline shows a graph from 1972 to 2014 of United Arab Emirates. No data until 1971. Number of actual observations by date: 39.
Source name:
World Development Indicators
Source organization:
IEA Statistics © OECD/IEA 2014 (http://www.iea.org/stats/index.asp), subject to https://www.iea.org/t&c/termsandconditions/
Categories, topics:
Energy & Mining
Last updated:
apr 23, 2017
Indicators value changes by year
Minimum:
99.855
jan 1, 1993
At the date of observation
Value
Absolute change
Change from previous value
jan 1, 1972
100.0
+100.0
0.0%
jan 1, 1973
100.0
0.0
0.0%
jan 1, 1974
100.0
0.0
0.0%
jan 1, 1975
100.0
0.0
0.0%
jan 1, 1976
100.0
0.0
0.0%
jan 1, 1977
100.0
0.0
0.0%
jan 1, 1978
100.0
0.0
0.0%
jan 1, 1979
100.0
0.0
0.0%
jan 1, 1980
100.0
0.0
0.0%
jan 1, 1981
100.0
+0.0
0.0%
jan 1, 1984
100.0
+0.0
0.0%
jan 1, 1985
100.0
+0.0
0.0%
jan 1, 1987
100.0
+0.0
0.0%
jan 1, 1988
100.0
0.0
0.0%
jan 1, 1989
100.0
0.0
0.0%
jan 1, 1990
100.0
0.0
0.0%
jan 1, 1991
100.0
0.0
0.0%
jan 1, 1993
99.855
-0.145
-0.14%
jan 1, 1994
99.887
+0.032
0.03%
jan 1, 1995
99.91
+0.022
0.02%
jan 1, 1996
99.915
+0.005
0.01%
jan 1, 1997
99.944
+0.029
0.03%
jan 1, 1998
99.943
-0.001
0.0%
jan 1, 1999
99.947
+0.004
0.0%
jan 1, 2000
99.948
+0.001
0.0%
jan 1, 2001
99.95
+0.002
0.0%
jan 1, 2002
99.955
+0.005
0.0%
jan 1, 2003
99.958
+0.004
0.0%
jan 1, 2004
99.958
0.0
0.0%
jan 1, 2005
99.941
-0.017
-0.02%
jan 1, 2006
99.934
-0.007
-0.01%
jan 1, 2007
99.927
-0.007
-0.01%
jan 1, 2008
99.919
-0.007
-0.01%
jan 1, 2009
99.918
-0.001
0.0%
jan 1, 2010
99.909
-0.009
-0.01%
jan 1, 2011
99.904
-0.006
-0.01%
jan 1, 2012
99.9
-0.004
0.0%
jan 1, 2013
99.905
+0.006
0.01%
jan 1, 2014
99.908
+0.002
0.0%
Ranking of countries by current statistics by years


Comments: