29
/
en
AIzaSyAYiBZKx7MnpbEhh9jyipgxe19OcubqV5w
April 1, 2024
194214
Mauritius
MUS
true
2
1
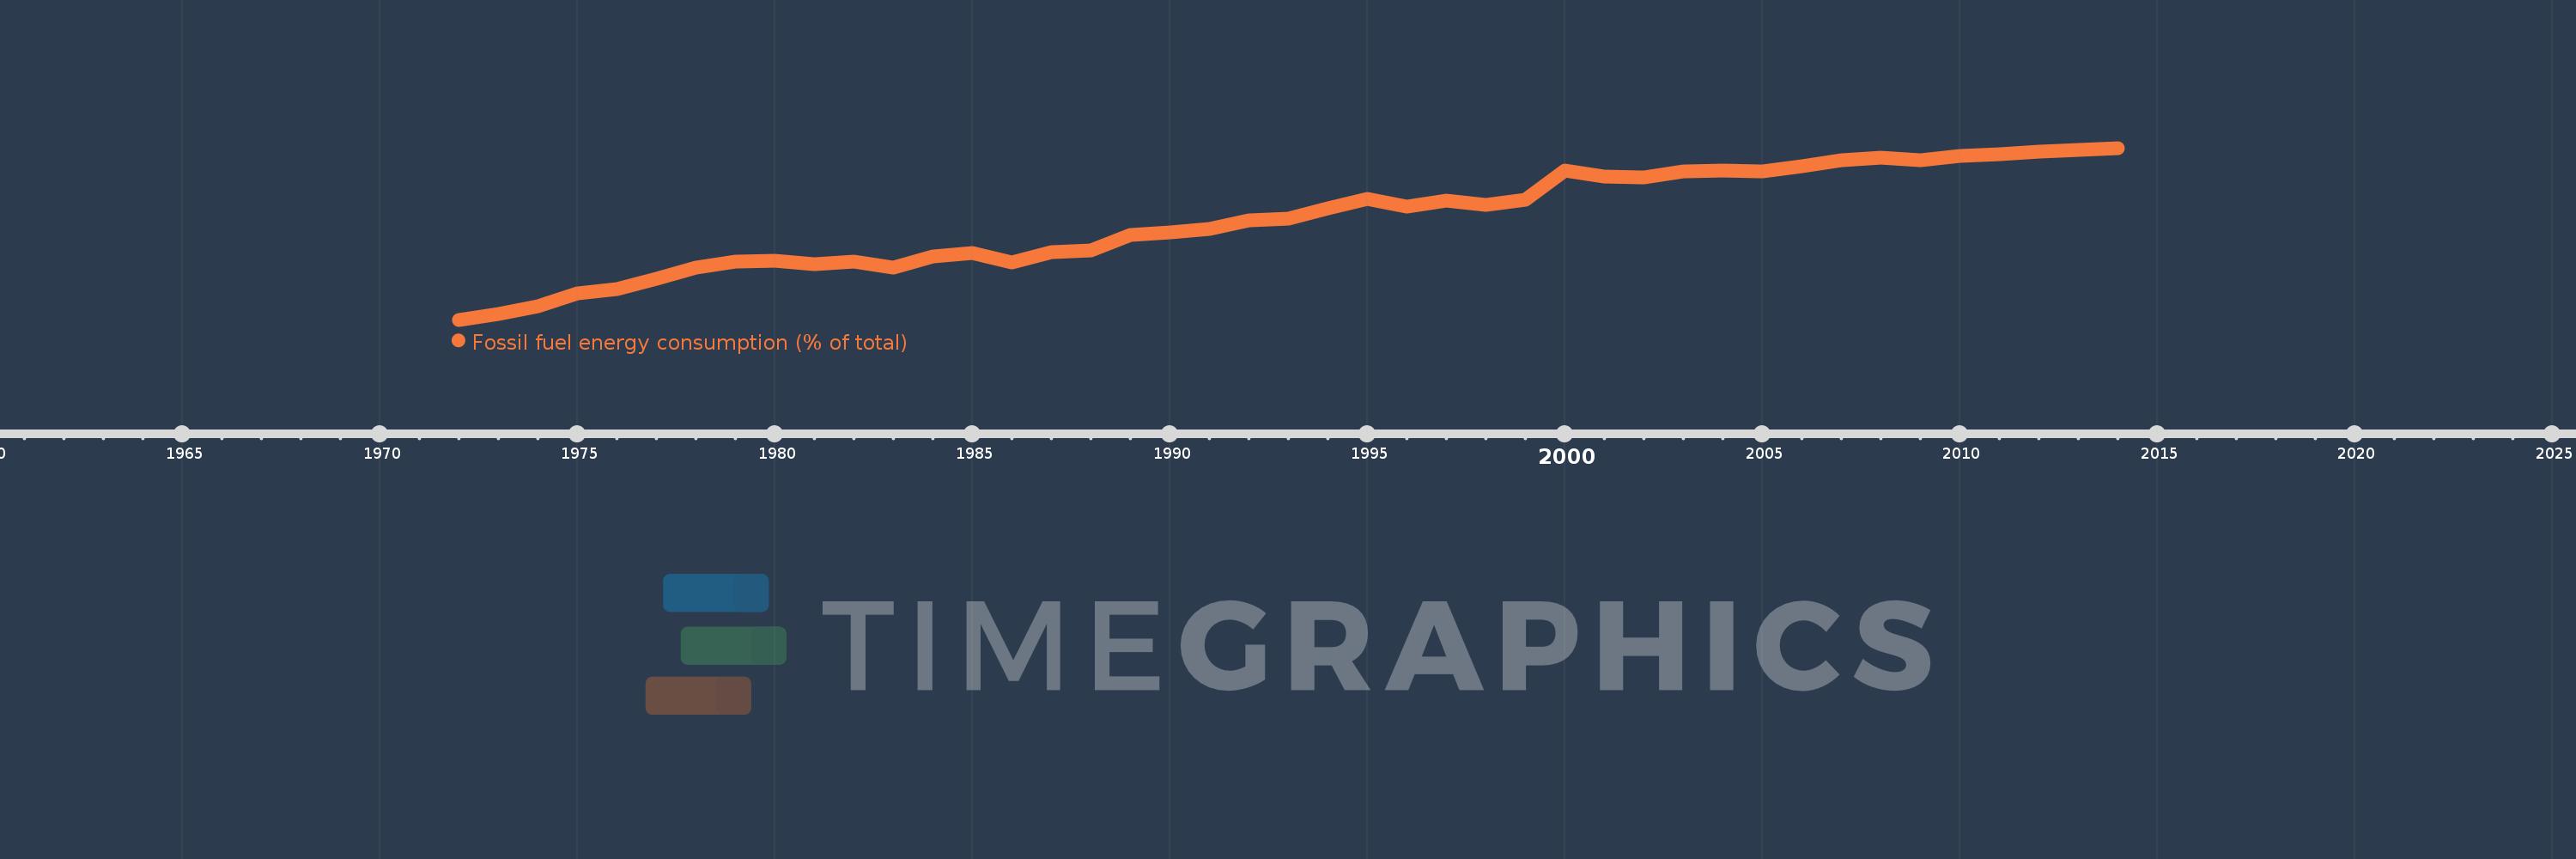
Fossil fuel energy consumption (% of total)
2014,2013,2012,2011,2010,2009,2008,2007,2006,2005,2004,2003,2002,2001,2000,1999,1998,1997,1996,1995,1994,1993,1992,1991,1990,1989,1988,1987,1986,1985,1984,1983,1982,1981,1980,1979,1978,1977,1976,1975,1974,1973,1972
This statistics in other country:
AlbaniaAlgeriaAngolaAntigua and BarbudaArab WorldArgentinaArmeniaAustraliaAustriaAzerbaijanBahamas, TheBahrainBangladeshBarbadosBelarusBelgiumBelizeBeninBhutanBoliviaBosnia and HerzegovinaBotswanaBrazilBrunei DarussalamBulgariaCabo VerdeCambodiaCameroonCanadaCaribbean small statesCentral Europe and the BalticsChileChinaColombiaComorosCongo, Dem. Rep.Congo, Rep.Costa RicaCote d'IvoireCroatiaCubaCuracaoCyprusCzech RepublicDenmarkDjiboutiDominicaDominican RepublicEarly-demographic dividendEast Asia & PacificEast Asia & Pacific (excluding high income)East Asia & Pacific (IDA & IBRD countries)EcuadorEgypt, Arab Rep.El SalvadorEquatorial GuineaEritreaEstoniaEthiopiaEuro areaEurope & Central AsiaEurope & Central Asia (excluding high income)Europe & Central Asia (IDA & IBRD countries)European UnionFijiFinlandFragile and conflict affected situationsFranceGabonGambia, TheGeorgiaGermanyGhanaGibraltarGreeceGrenadaGuatemalaGuinea-BissauGuyanaHaitiHeavily indebted poor countries (HIPC)High incomeHondurasHong Kong SAR, ChinaHungaryIBRD onlyIcelandIDA & IBRD totalIDA blendIDA onlyIDA totalIndiaIndonesiaIran, Islamic Rep.IraqIrelandIsraelItalyJamaicaJapanJordanKazakhstanKenyaKiribatiKorea, Dem. People’s Rep.Korea, Rep.KosovoKuwaitKyrgyz RepublicLate-demographic dividendLatin America & Caribbean Latin America & Caribbean (excluding high income)Latin America & the Caribbean (IDA & IBRD countries)LatviaLeast developed countries: UN classificationLebanonLesothoLibyaLithuaniaLow & middle incomeLow incomeLower middle incomeLuxembourgMacedonia, FYRMalaysiaMaldivesMaltaMarshall IslandsMauritiusMexicoMiddle East & North AfricaMiddle East & North Africa (excluding high income)Middle East & North Africa (IDA & IBRD countries)Middle incomeMoldovaMongoliaMontenegroMoroccoMozambiqueMyanmarNamibiaNepalNetherlandsNew ZealandNicaraguaNigerNigeriaNorth AmericaNorwayOECD membersOmanOther small statesPacific island small statesPakistanPalauPanamaParaguayPeruPhilippinesPolandPortugalPost-demographic dividendPre-demographic dividendQatarRomaniaRussian FederationSamoaSao Tome and PrincipeSaudi ArabiaSenegalSerbiaSeychellesSingaporeSlovak RepublicSloveniaSmall statesSolomon IslandsSouth AfricaSouth AsiaSouth Asia (IDA & IBRD)South SudanSpainSri LankaSt. Kitts and NevisSt. LuciaSt. Vincent and the GrenadinesSub-Saharan Africa Sub-Saharan Africa (excluding high income)Sub-Saharan Africa (IDA & IBRD countries)SudanSurinameSwazilandSwedenSwitzerlandSyrian Arab RepublicTajikistanTanzaniaThailandTimor-LesteTogoTongaTrinidad and TobagoTunisiaTurkeyUkraineUnited Arab EmiratesUnited KingdomUnited StatesUpper middle incomeUruguayUzbekistanVanuatuVenezuela, RBVietnamWorldYemen, Rep.ZambiaZimbabwe Timeline:
This timeline shows a graph from 1972 to 2014 of Mauritius. No data until 1971. Number of actual observations by date: 43.
Source name:
World Development Indicators
Source organization:
IEA Statistics © OECD/IEA 2014 (http://www.iea.org/stats/index.asp), subject to https://www.iea.org/t&c/termsandconditions/
Categories, topics:
Energy & Mining
Last updated:
apr 23, 2017
Indicators value changes by year
Minimum:
23.405
jan 1, 1972
Maximum:
83.781
jan 1, 2014
At the date of observation
Value
Absolute change
Change from previous value
jan 1, 1972
23.405
+23.405
0.0%
jan 1, 1973
25.486
+2.081
8.89%
jan 1, 1974
28.142
+2.656
10.42%
jan 1, 1975
32.617
+4.475
15.9%
jan 1, 1976
34.203
+1.586
4.86%
jan 1, 1977
37.836
+3.633
10.62%
jan 1, 1978
41.654
+3.818
10.09%
jan 1, 1979
43.914
+2.259
5.42%
jan 1, 1980
44.198
+0.285
0.65%
jan 1, 1981
42.948
-1.251
-2.83%
jan 1, 1982
43.697
+0.749
1.74%
jan 1, 1983
41.722
-1.975
-4.52%
jan 1, 1984
45.727
+4.006
9.6%
jan 1, 1985
46.878
+1.15
2.52%
jan 1, 1986
43.493
-3.384
-7.22%
jan 1, 1987
47.134
+3.641
8.37%
jan 1, 1988
47.876
+0.742
1.57%
jan 1, 1989
53.307
+5.432
11.35%
jan 1, 1990
54.181
+0.874
1.64%
jan 1, 1991
55.459
+1.278
2.36%
jan 1, 1992
58.456
+2.996
5.4%
jan 1, 1993
59.048
+0.592
1.01%
jan 1, 1994
62.678
+3.63
6.15%
jan 1, 1995
65.873
+3.194
5.1%
jan 1, 1996
63.296
-2.577
-3.91%
jan 1, 1997
65.394
+2.098
3.32%
jan 1, 1998
63.788
-1.606
-2.46%
jan 1, 1999
65.492
+1.704
2.67%
jan 1, 2000
75.802
+10.311
15.74%
jan 1, 2001
73.863
-1.939
-2.56%
jan 1, 2002
73.528
-0.335
-0.45%
jan 1, 2003
75.421
+1.893
2.57%
jan 1, 2004
75.841
+0.421
0.56%
jan 1, 2005
75.464
-0.378
-0.5%
jan 1, 2006
77.398
+1.934
2.56%
jan 1, 2007
79.504
+2.105
2.72%
jan 1, 2008
80.326
+0.822
1.03%
jan 1, 2009
79.389
-0.937
-1.17%
jan 1, 2010
81.047
+1.658
2.09%
jan 1, 2011
81.656
+0.609
0.75%
jan 1, 2012
82.44
+0.783
0.96%
jan 1, 2013
83.153
+0.714
0.87%
jan 1, 2014
83.781
+0.628
0.76%
Ranking of countries by current statistics by years


Comments: