29
/
en
AIzaSyAYiBZKx7MnpbEhh9jyipgxe19OcubqV5w
April 1, 2024
275678
United Kingdom
GBR
true
2
1
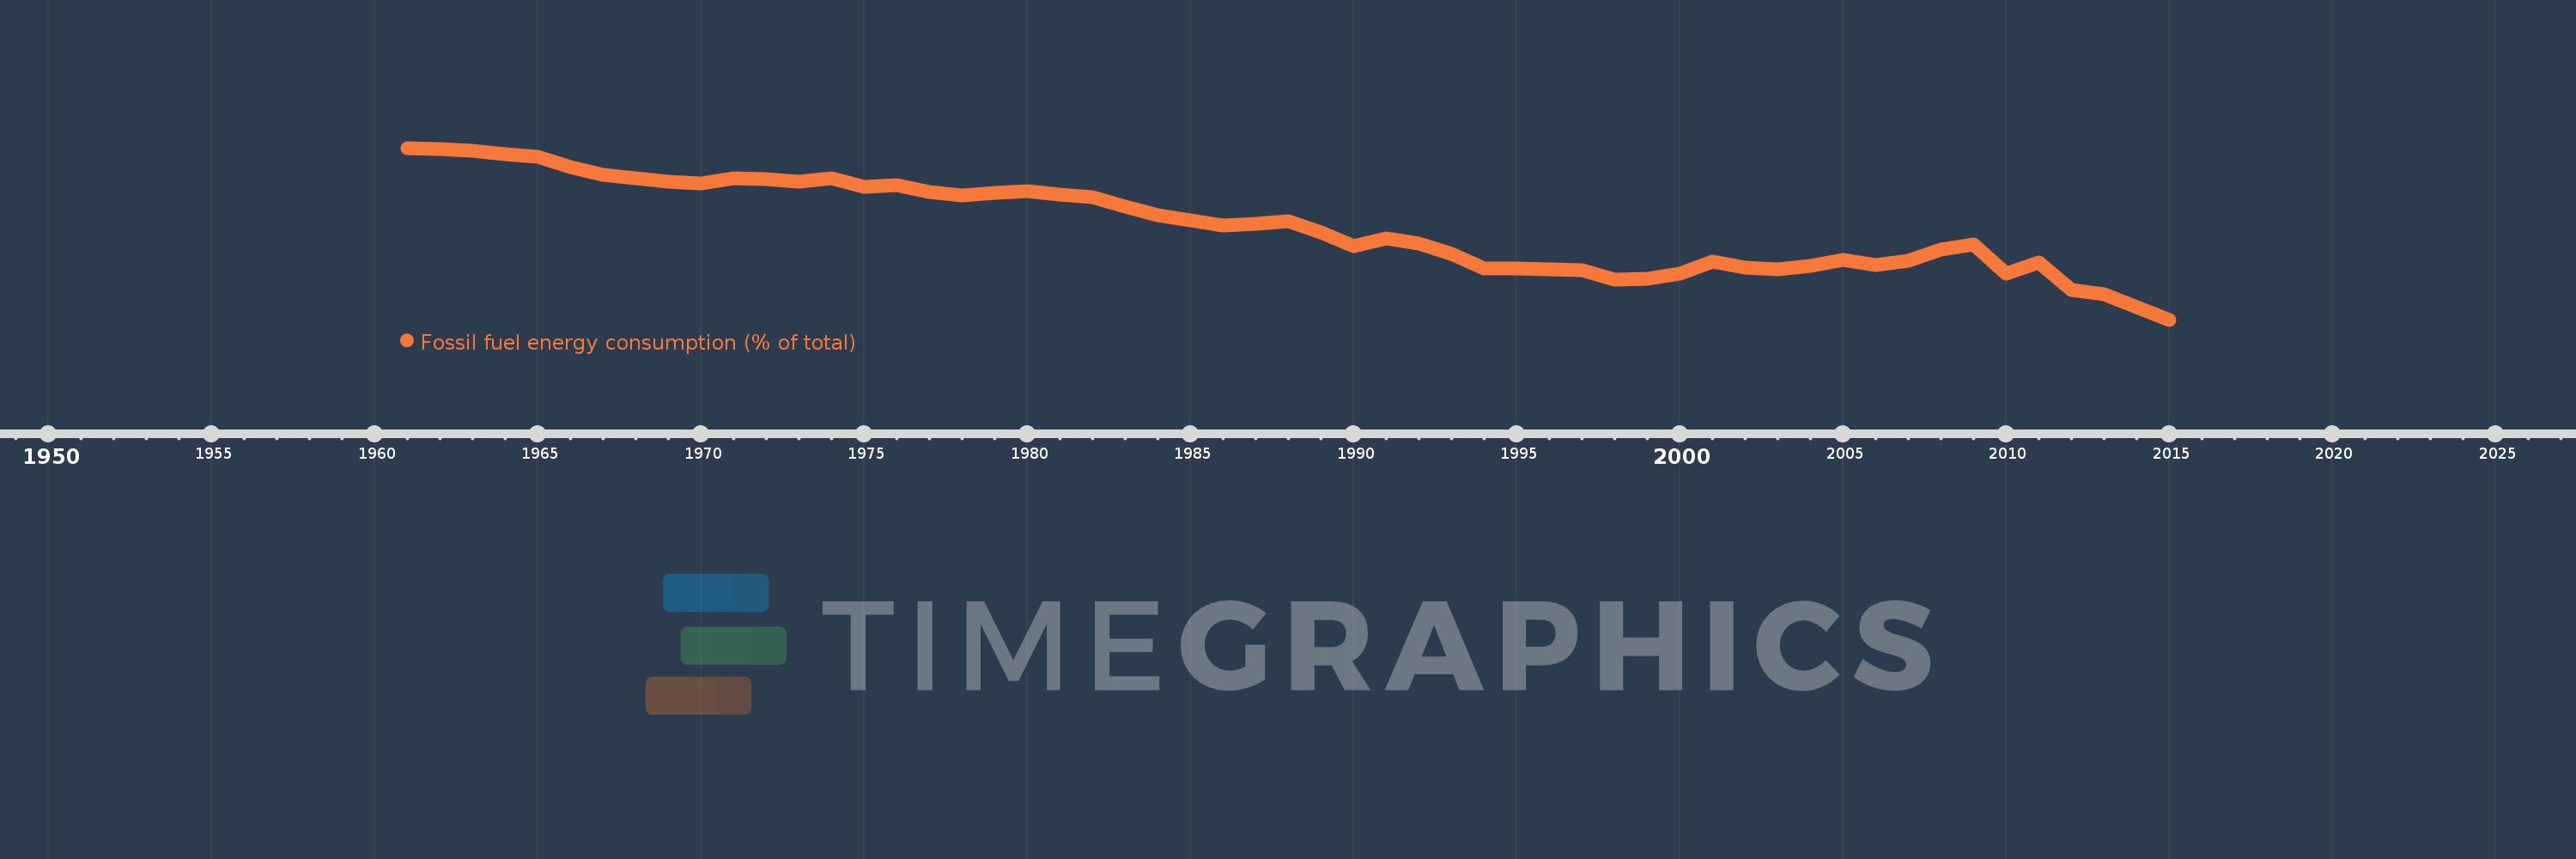
Fossil fuel energy consumption (% of total)
2015,2014,2013,2012,2011,2010,2009,2008,2007,2006,2005,2004,2003,2002,2001,2000,1999,1998,1997,1996,1995,1994,1993,1992,1991,1990,1989,1988,1987,1986,1985,1984,1983,1982,1981,1980,1979,1978,1977,1976,1975,1974,1973,1972,1971,1970,1969,1968,1967,1966,1965,1964,1963,1962,1961
This statistics in other country:
AlbaniaAlgeriaAngolaAntigua and BarbudaArab WorldArgentinaArmeniaAustraliaAustriaAzerbaijanBahamas, TheBahrainBangladeshBarbadosBelarusBelgiumBelizeBeninBhutanBoliviaBosnia and HerzegovinaBotswanaBrazilBrunei DarussalamBulgariaCabo VerdeCambodiaCameroonCanadaCaribbean small statesCentral Europe and the BalticsChileChinaColombiaComorosCongo, Dem. Rep.Congo, Rep.Costa RicaCote d'IvoireCroatiaCubaCuracaoCyprusCzech RepublicDenmarkDjiboutiDominicaDominican RepublicEarly-demographic dividendEast Asia & PacificEast Asia & Pacific (excluding high income)East Asia & Pacific (IDA & IBRD countries)EcuadorEgypt, Arab Rep.El SalvadorEquatorial GuineaEritreaEstoniaEthiopiaEuro areaEurope & Central AsiaEurope & Central Asia (excluding high income)Europe & Central Asia (IDA & IBRD countries)European UnionFijiFinlandFragile and conflict affected situationsFranceGabonGambia, TheGeorgiaGermanyGhanaGibraltarGreeceGrenadaGuatemalaGuinea-BissauGuyanaHaitiHeavily indebted poor countries (HIPC)High incomeHondurasHong Kong SAR, ChinaHungaryIBRD onlyIcelandIDA & IBRD totalIDA blendIDA onlyIDA totalIndiaIndonesiaIran, Islamic Rep.IraqIrelandIsraelItalyJamaicaJapanJordanKazakhstanKenyaKiribatiKorea, Dem. People’s Rep.Korea, Rep.KosovoKuwaitKyrgyz RepublicLate-demographic dividendLatin America & Caribbean Latin America & Caribbean (excluding high income)Latin America & the Caribbean (IDA & IBRD countries)LatviaLeast developed countries: UN classificationLebanonLesothoLibyaLithuaniaLow & middle incomeLow incomeLower middle incomeLuxembourgMacedonia, FYRMalaysiaMaldivesMaltaMarshall IslandsMauritiusMexicoMiddle East & North AfricaMiddle East & North Africa (excluding high income)Middle East & North Africa (IDA & IBRD countries)Middle incomeMoldovaMongoliaMontenegroMoroccoMozambiqueMyanmarNamibiaNepalNetherlandsNew ZealandNicaraguaNigerNigeriaNorth AmericaNorwayOECD membersOmanOther small statesPacific island small statesPakistanPalauPanamaParaguayPeruPhilippinesPolandPortugalPost-demographic dividendPre-demographic dividendQatarRomaniaRussian FederationSamoaSao Tome and PrincipeSaudi ArabiaSenegalSerbiaSeychellesSingaporeSlovak RepublicSloveniaSmall statesSolomon IslandsSouth AfricaSouth AsiaSouth Asia (IDA & IBRD)South SudanSpainSri LankaSt. Kitts and NevisSt. LuciaSt. Vincent and the GrenadinesSub-Saharan Africa Sub-Saharan Africa (excluding high income)Sub-Saharan Africa (IDA & IBRD countries)SudanSurinameSwazilandSwedenSwitzerlandSyrian Arab RepublicTajikistanTanzaniaThailandTimor-LesteTogoTongaTrinidad and TobagoTunisiaTurkeyUkraineUnited Arab EmiratesUnited KingdomUnited StatesUpper middle incomeUruguayUzbekistanVanuatuVenezuela, RBVietnamWorldYemen, Rep.ZambiaZimbabwe Timeline:
This timeline shows a graph from 1961 to 2015 of United Kingdom. No data until 1960. Number of actual observations by date: 55.
Source name:
World Development Indicators
Source organization:
IEA Statistics © OECD/IEA 2014 (http://www.iea.org/stats/index.asp), subject to https://www.iea.org/t&c/termsandconditions/
Categories, topics:
Energy & Mining
Last updated:
apr 23, 2017
Indicators value changes by year
Minimum:
82.789
jan 1, 2015
Maximum:
99.465
jan 1, 1961
At the date of observation
Value
Absolute change
Change from previous value
jan 1, 1961
99.465
+99.465
0.0%
jan 1, 1962
99.368
-0.096
-0.1%
jan 1, 1963
99.208
-0.161
-0.16%
jan 1, 1964
98.868
-0.34
-0.34%
jan 1, 1965
98.606
-0.262
-0.26%
jan 1, 1966
97.617
-0.989
-1.0%
jan 1, 1967
96.877
-0.74
-0.76%
jan 1, 1968
96.488
-0.389
-0.4%
jan 1, 1969
96.174
-0.313
-0.32%
jan 1, 1970
95.986
-0.188
-0.2%
jan 1, 1971
96.484
+0.498
0.52%
jan 1, 1972
96.416
-0.067
-0.07%
jan 1, 1973
96.199
-0.217
-0.23%
jan 1, 1974
96.5
+0.3
0.31%
jan 1, 1975
95.66
-0.84
-0.87%
jan 1, 1976
95.869
+0.209
0.22%
jan 1, 1977
95.214
-0.655
-0.68%
jan 1, 1978
94.817
-0.397
-0.42%
jan 1, 1979
95.14
+0.323
0.34%
jan 1, 1980
95.232
+0.092
0.1%
jan 1, 1981
94.969
-0.264
-0.28%
jan 1, 1982
94.663
-0.306
-0.32%
jan 1, 1983
93.806
-0.857
-0.9%
jan 1, 1984
92.956
-0.85
-0.91%
jan 1, 1985
92.423
-0.534
-0.57%
jan 1, 1986
91.896
-0.527
-0.57%
jan 1, 1987
92.07
+0.174
0.19%
jan 1, 1988
92.338
+0.268
0.29%
jan 1, 1989
91.29
-1.048
-1.14%
jan 1, 1990
89.928
-1.362
-1.49%
jan 1, 1991
90.653
+0.725
0.81%
jan 1, 1992
90.199
-0.453
-0.5%
jan 1, 1993
89.213
-0.986
-1.09%
jan 1, 1994
87.79
-1.423
-1.59%
jan 1, 1995
87.79
0.0
0.0%
jan 1, 1996
87.711
-0.079
-0.09%
jan 1, 1997
87.57
-0.141
-0.16%
jan 1, 1998
86.72
-0.85
-0.97%
jan 1, 1999
86.771
+0.051
0.06%
jan 1, 2000
87.235
+0.465
0.54%
jan 1, 2001
88.41
+1.175
1.35%
jan 1, 2002
87.829
-0.581
-0.66%
jan 1, 2003
87.724
-0.105
-0.12%
jan 1, 2004
87.98
+0.256
0.29%
jan 1, 2005
88.561
+0.581
0.66%
jan 1, 2006
88.077
-0.484
-0.55%
jan 1, 2007
88.55
+0.473
0.54%
jan 1, 2008
89.574
+1.024
1.16%
jan 1, 2009
90.1
+0.526
0.59%
jan 1, 2010
87.285
-2.815
-3.12%
jan 1, 2011
88.341
+1.056
1.21%
jan 1, 2012
85.699
-2.642
-2.99%
jan 1, 2013
85.259
-0.44
-0.51%
jan 1, 2014
84.036
-1.223
-1.43%
jan 1, 2015
82.789
-1.246
-1.48%
Ranking of countries by current statistics by years


Comments: