29
/
en
AIzaSyAYiBZKx7MnpbEhh9jyipgxe19OcubqV5w
April 1, 2024
107235
Colombia
COL
true
2
1
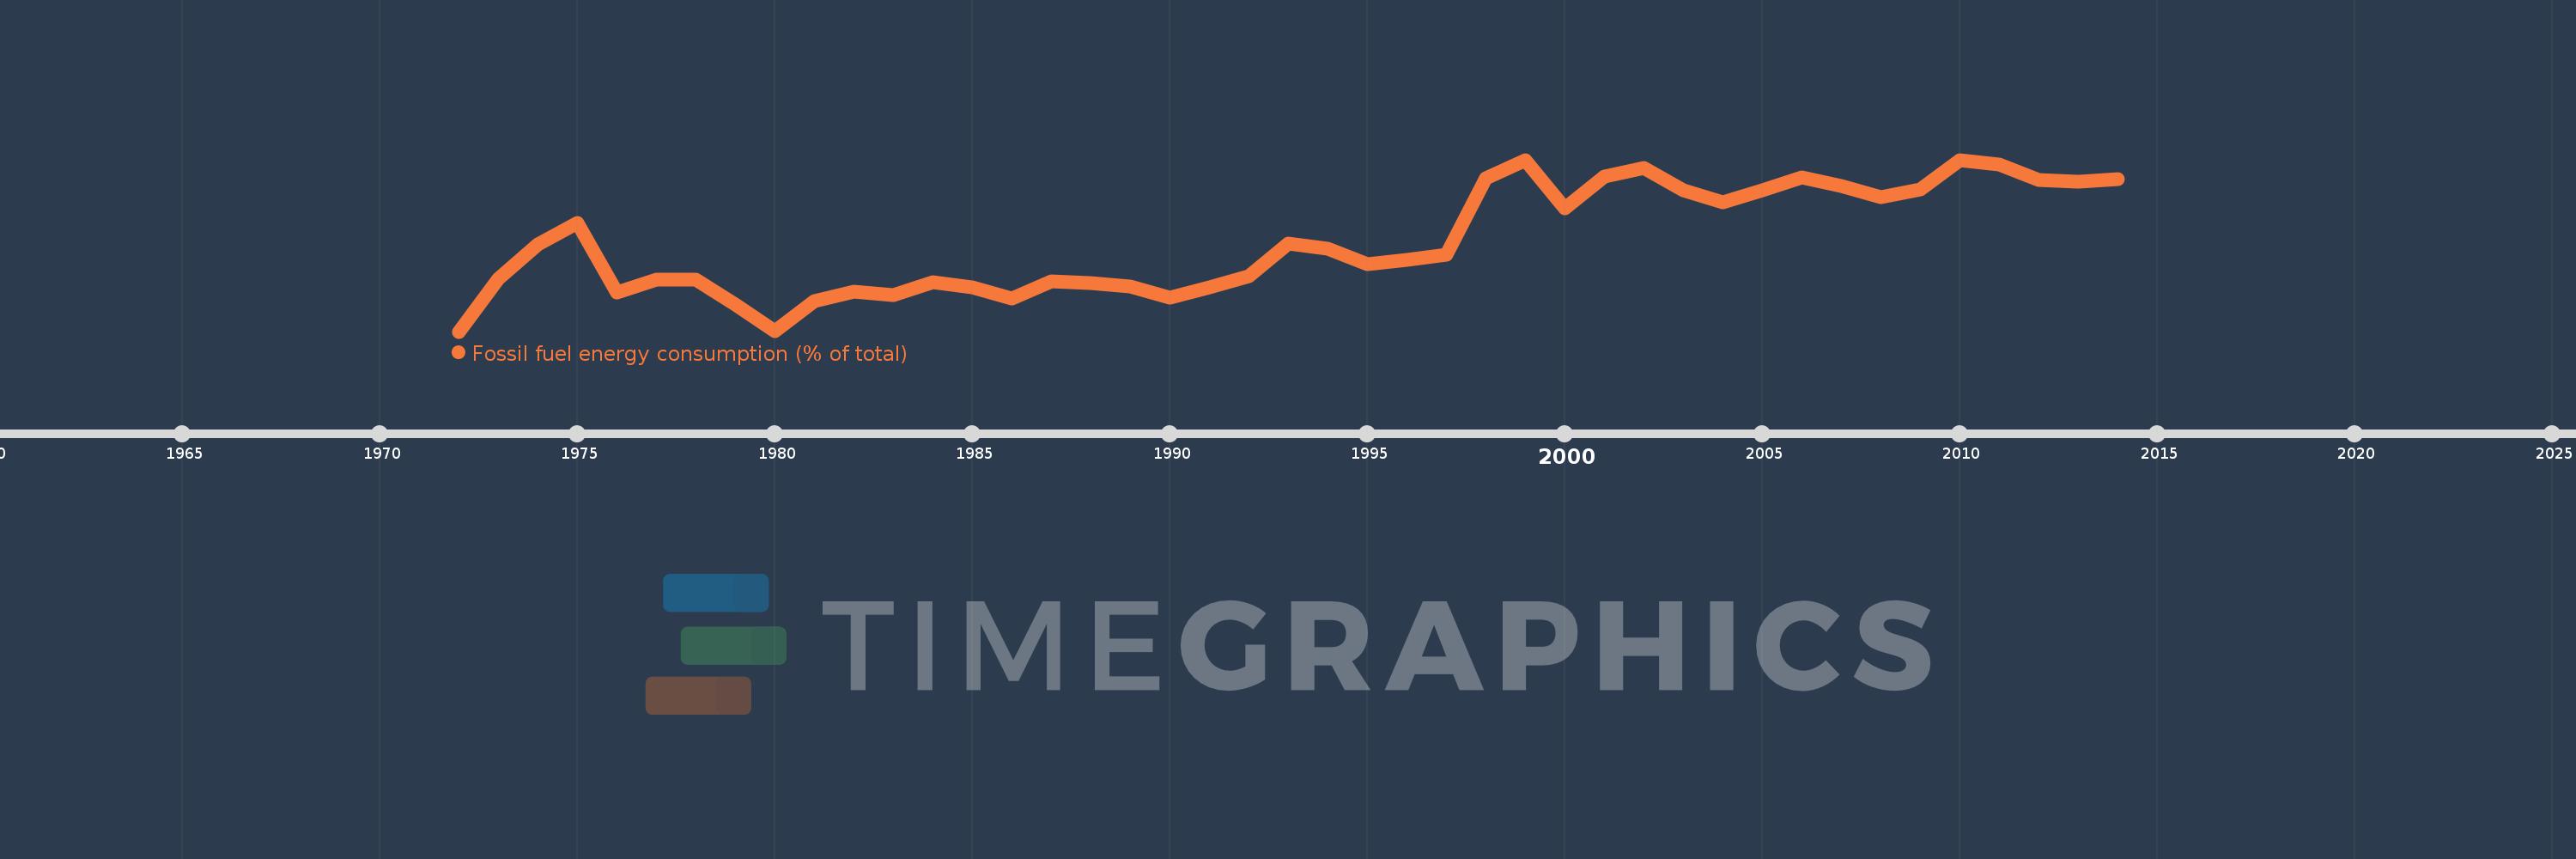
Fossil fuel energy consumption (% of total)
2014,2013,2012,2011,2010,2009,2008,2007,2006,2005,2004,2003,2002,2001,2000,1999,1998,1997,1996,1995,1994,1993,1992,1991,1990,1989,1988,1987,1986,1985,1984,1983,1982,1981,1980,1979,1978,1977,1976,1975,1974,1973,1972
This statistics in other country:
AlbaniaAlgeriaAngolaAntigua and BarbudaArab WorldArgentinaArmeniaAustraliaAustriaAzerbaijanBahamas, TheBahrainBangladeshBarbadosBelarusBelgiumBelizeBeninBhutanBoliviaBosnia and HerzegovinaBotswanaBrazilBrunei DarussalamBulgariaCabo VerdeCambodiaCameroonCanadaCaribbean small statesCentral Europe and the BalticsChileChinaColombiaComorosCongo, Dem. Rep.Congo, Rep.Costa RicaCote d'IvoireCroatiaCubaCuracaoCyprusCzech RepublicDenmarkDjiboutiDominicaDominican RepublicEarly-demographic dividendEast Asia & PacificEast Asia & Pacific (excluding high income)East Asia & Pacific (IDA & IBRD countries)EcuadorEgypt, Arab Rep.El SalvadorEquatorial GuineaEritreaEstoniaEthiopiaEuro areaEurope & Central AsiaEurope & Central Asia (excluding high income)Europe & Central Asia (IDA & IBRD countries)European UnionFijiFinlandFragile and conflict affected situationsFranceGabonGambia, TheGeorgiaGermanyGhanaGibraltarGreeceGrenadaGuatemalaGuinea-BissauGuyanaHaitiHeavily indebted poor countries (HIPC)High incomeHondurasHong Kong SAR, ChinaHungaryIBRD onlyIcelandIDA & IBRD totalIDA blendIDA onlyIDA totalIndiaIndonesiaIran, Islamic Rep.IraqIrelandIsraelItalyJamaicaJapanJordanKazakhstanKenyaKiribatiKorea, Dem. People’s Rep.Korea, Rep.KosovoKuwaitKyrgyz RepublicLate-demographic dividendLatin America & Caribbean Latin America & Caribbean (excluding high income)Latin America & the Caribbean (IDA & IBRD countries)LatviaLeast developed countries: UN classificationLebanonLesothoLibyaLithuaniaLow & middle incomeLow incomeLower middle incomeLuxembourgMacedonia, FYRMalaysiaMaldivesMaltaMarshall IslandsMauritiusMexicoMiddle East & North AfricaMiddle East & North Africa (excluding high income)Middle East & North Africa (IDA & IBRD countries)Middle incomeMoldovaMongoliaMontenegroMoroccoMozambiqueMyanmarNamibiaNepalNetherlandsNew ZealandNicaraguaNigerNigeriaNorth AmericaNorwayOECD membersOmanOther small statesPacific island small statesPakistanPalauPanamaParaguayPeruPhilippinesPolandPortugalPost-demographic dividendPre-demographic dividendQatarRomaniaRussian FederationSamoaSao Tome and PrincipeSaudi ArabiaSenegalSerbiaSeychellesSingaporeSlovak RepublicSloveniaSmall statesSolomon IslandsSouth AfricaSouth AsiaSouth Asia (IDA & IBRD)South SudanSpainSri LankaSt. Kitts and NevisSt. LuciaSt. Vincent and the GrenadinesSub-Saharan Africa Sub-Saharan Africa (excluding high income)Sub-Saharan Africa (IDA & IBRD countries)SudanSurinameSwazilandSwedenSwitzerlandSyrian Arab RepublicTajikistanTanzaniaThailandTimor-LesteTogoTongaTrinidad and TobagoTunisiaTurkeyUkraineUnited Arab EmiratesUnited KingdomUnited StatesUpper middle incomeUruguayUzbekistanVanuatuVenezuela, RBVietnamWorldYemen, Rep.ZambiaZimbabwe Timeline:
This timeline shows a graph from 1972 to 2014 of Colombia. No data until 1971. Number of actual observations by date: 43.
Source name:
World Development Indicators
Source organization:
IEA Statistics © OECD/IEA 2014 (http://www.iea.org/stats/index.asp), subject to https://www.iea.org/t&c/termsandconditions/
Categories, topics:
Energy & Mining
Last updated:
apr 23, 2017
Indicators value changes by year
Minimum:
63.938
jan 1, 1972
Maximum:
77.307
jan 1, 2010
At the date of observation
Value
Absolute change
Change from previous value
jan 1, 1972
63.938
+63.938
0.0%
jan 1, 1973
68.049
+4.111
6.43%
jan 1, 1974
70.706
+2.657
3.9%
jan 1, 1975
72.381
+1.674
2.37%
jan 1, 1976
66.998
-5.383
-7.44%
jan 1, 1977
67.996
+0.998
1.49%
jan 1, 1978
67.999
+0.003
0.0%
jan 1, 1979
66.027
-1.972
-2.9%
jan 1, 1980
63.979
-2.048
-3.1%
jan 1, 1981
66.334
+2.355
3.68%
jan 1, 1982
67.032
+0.698
1.05%
jan 1, 1983
66.769
-0.263
-0.39%
jan 1, 1984
67.774
+1.005
1.51%
jan 1, 1985
67.351
-0.424
-0.62%
jan 1, 1986
66.488
-0.863
-1.28%
jan 1, 1987
67.826
+1.338
2.01%
jan 1, 1988
67.703
-0.123
-0.18%
jan 1, 1989
67.478
-0.224
-0.33%
jan 1, 1990
66.595
-0.883
-1.31%
jan 1, 1991
67.38
+0.784
1.18%
jan 1, 1992
68.221
+0.842
1.25%
jan 1, 1993
70.809
+2.587
3.79%
jan 1, 1994
70.361
-0.447
-0.63%
jan 1, 1995
69.181
-1.181
-1.68%
jan 1, 1996
69.51
+0.33
0.48%
jan 1, 1997
69.904
+0.394
0.57%
jan 1, 1998
75.851
+5.947
8.51%
jan 1, 1999
77.262
+1.411
1.86%
jan 1, 2000
73.529
-3.733
-4.83%
jan 1, 2001
76.014
+2.485
3.38%
jan 1, 2002
76.676
+0.662
0.87%
jan 1, 2003
74.948
-1.728
-2.25%
jan 1, 2004
73.973
-0.975
-1.3%
jan 1, 2005
74.926
+0.953
1.29%
jan 1, 2006
75.923
+0.997
1.33%
jan 1, 2007
75.28
-0.643
-0.85%
jan 1, 2008
74.41
-0.869
-1.15%
jan 1, 2009
74.978
+0.568
0.76%
jan 1, 2010
77.307
+2.329
3.11%
jan 1, 2011
76.953
-0.354
-0.46%
jan 1, 2012
75.718
-1.235
-1.6%
jan 1, 2013
75.585
-0.134
-0.18%
jan 1, 2014
75.798
+0.214
0.28%
Ranking of countries by current statistics by years


Comments: