29
/
en
AIzaSyAYiBZKx7MnpbEhh9jyipgxe19OcubqV5w
April 1, 2024
225889
Portugal
PRT
true
2
1
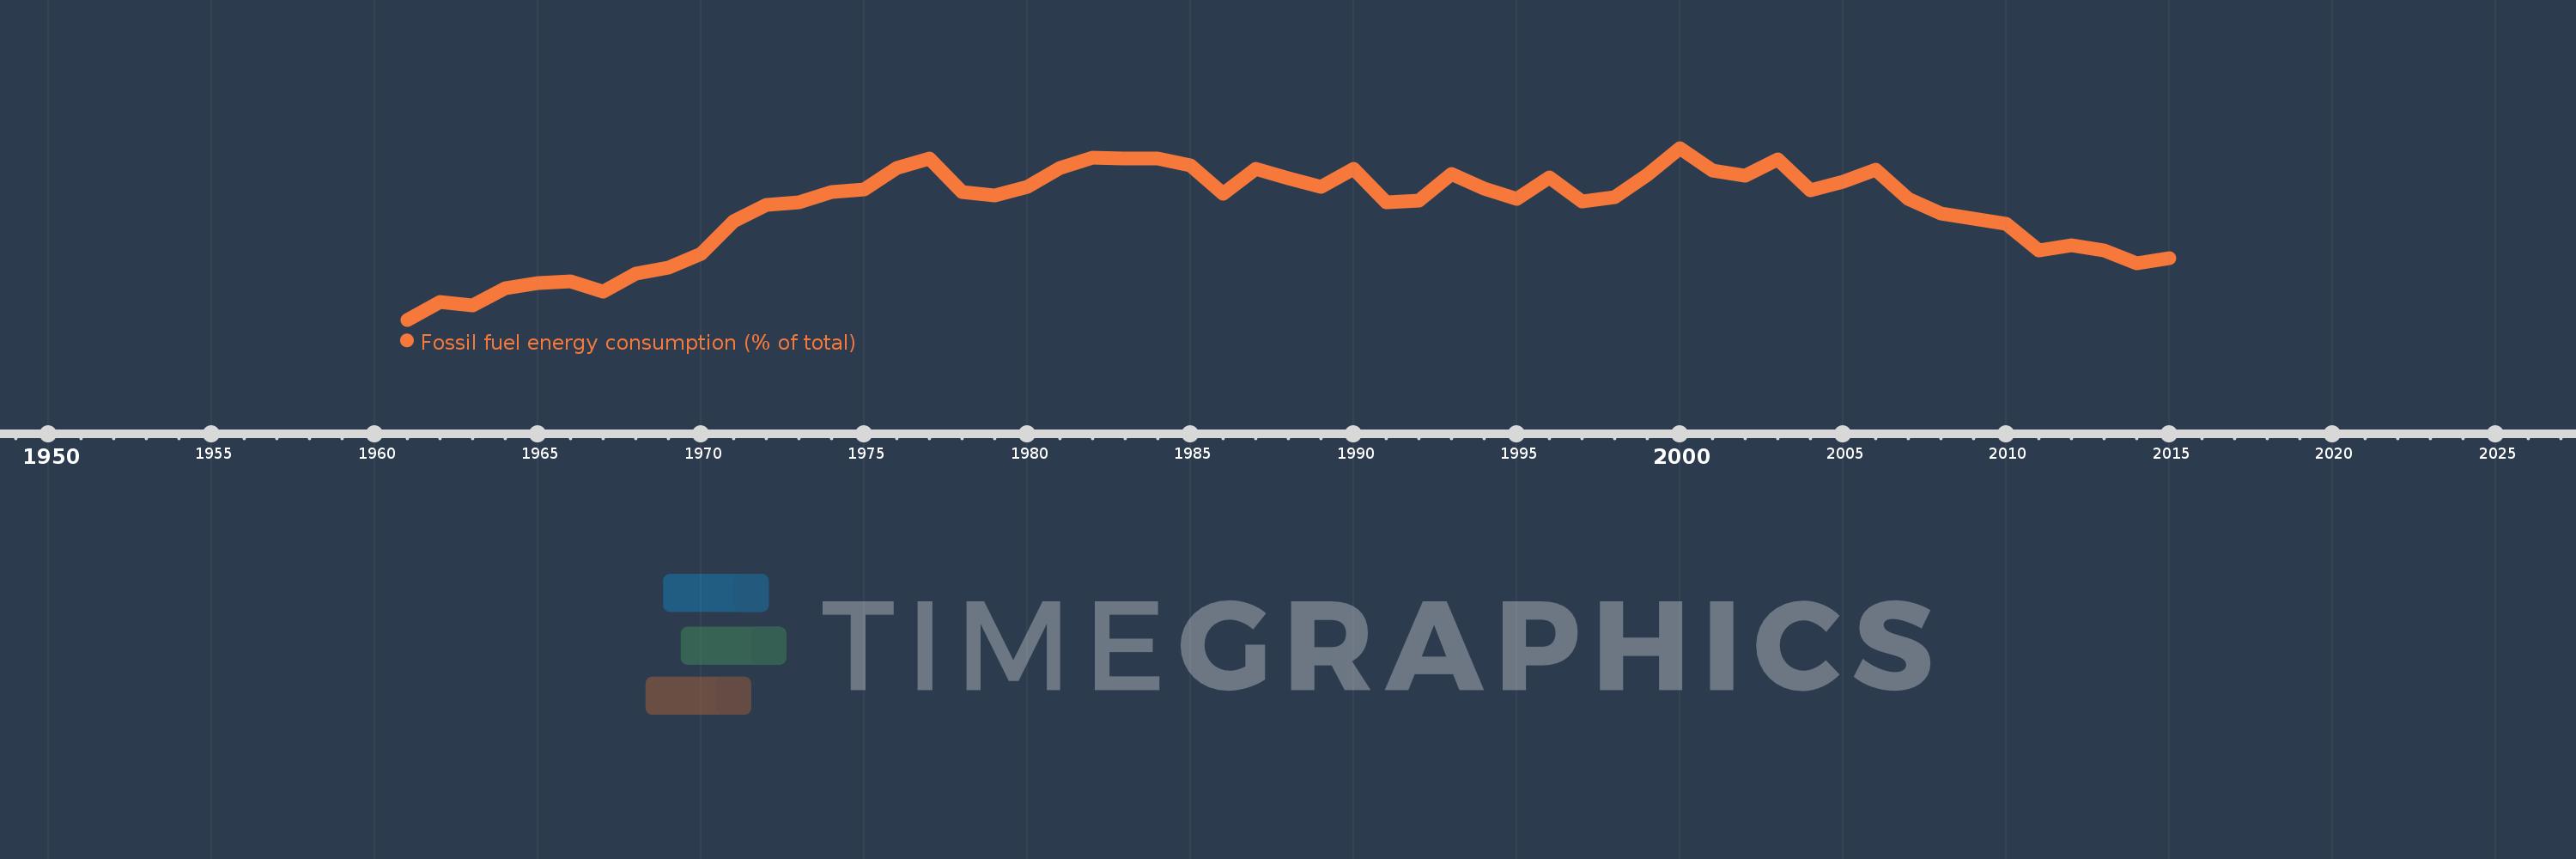
Fossil fuel energy consumption (% of total)
2015,2014,2013,2012,2011,2010,2009,2008,2007,2006,2005,2004,2003,2002,2001,2000,1999,1998,1997,1996,1995,1994,1993,1992,1991,1990,1989,1988,1987,1986,1985,1984,1983,1982,1981,1980,1979,1978,1977,1976,1975,1974,1973,1972,1971,1970,1969,1968,1967,1966,1965,1964,1963,1962,1961
This statistics in other country:
AlbaniaAlgeriaAngolaAntigua and BarbudaArab WorldArgentinaArmeniaAustraliaAustriaAzerbaijanBahamas, TheBahrainBangladeshBarbadosBelarusBelgiumBelizeBeninBhutanBoliviaBosnia and HerzegovinaBotswanaBrazilBrunei DarussalamBulgariaCabo VerdeCambodiaCameroonCanadaCaribbean small statesCentral Europe and the BalticsChileChinaColombiaComorosCongo, Dem. Rep.Congo, Rep.Costa RicaCote d'IvoireCroatiaCubaCuracaoCyprusCzech RepublicDenmarkDjiboutiDominicaDominican RepublicEarly-demographic dividendEast Asia & PacificEast Asia & Pacific (excluding high income)East Asia & Pacific (IDA & IBRD countries)EcuadorEgypt, Arab Rep.El SalvadorEquatorial GuineaEritreaEstoniaEthiopiaEuro areaEurope & Central AsiaEurope & Central Asia (excluding high income)Europe & Central Asia (IDA & IBRD countries)European UnionFijiFinlandFragile and conflict affected situationsFranceGabonGambia, TheGeorgiaGermanyGhanaGibraltarGreeceGrenadaGuatemalaGuinea-BissauGuyanaHaitiHeavily indebted poor countries (HIPC)High incomeHondurasHong Kong SAR, ChinaHungaryIBRD onlyIcelandIDA & IBRD totalIDA blendIDA onlyIDA totalIndiaIndonesiaIran, Islamic Rep.IraqIrelandIsraelItalyJamaicaJapanJordanKazakhstanKenyaKiribatiKorea, Dem. People’s Rep.Korea, Rep.KosovoKuwaitKyrgyz RepublicLate-demographic dividendLatin America & Caribbean Latin America & Caribbean (excluding high income)Latin America & the Caribbean (IDA & IBRD countries)LatviaLeast developed countries: UN classificationLebanonLesothoLibyaLithuaniaLow & middle incomeLow incomeLower middle incomeLuxembourgMacedonia, FYRMalaysiaMaldivesMaltaMarshall IslandsMauritiusMexicoMiddle East & North AfricaMiddle East & North Africa (excluding high income)Middle East & North Africa (IDA & IBRD countries)Middle incomeMoldovaMongoliaMontenegroMoroccoMozambiqueMyanmarNamibiaNepalNetherlandsNew ZealandNicaraguaNigerNigeriaNorth AmericaNorwayOECD membersOmanOther small statesPacific island small statesPakistanPalauPanamaParaguayPeruPhilippinesPolandPortugalPost-demographic dividendPre-demographic dividendQatarRomaniaRussian FederationSamoaSao Tome and PrincipeSaudi ArabiaSenegalSerbiaSeychellesSingaporeSlovak RepublicSloveniaSmall statesSolomon IslandsSouth AfricaSouth AsiaSouth Asia (IDA & IBRD)South SudanSpainSri LankaSt. Kitts and NevisSt. LuciaSt. Vincent and the GrenadinesSub-Saharan Africa Sub-Saharan Africa (excluding high income)Sub-Saharan Africa (IDA & IBRD countries)SudanSurinameSwazilandSwedenSwitzerlandSyrian Arab RepublicTajikistanTanzaniaThailandTimor-LesteTogoTongaTrinidad and TobagoTunisiaTurkeyUkraineUnited Arab EmiratesUnited KingdomUnited StatesUpper middle incomeUruguayUzbekistanVanuatuVenezuela, RBVietnamWorldYemen, Rep.ZambiaZimbabwe Timeline:
This timeline shows a graph from 1961 to 2015 of Portugal. No data until 1960. Number of actual observations by date: 55.
Source name:
World Development Indicators
Source organization:
IEA Statistics © OECD/IEA 2014 (http://www.iea.org/stats/index.asp), subject to https://www.iea.org/t&c/termsandconditions/
Categories, topics:
Energy & Mining
Last updated:
apr 23, 2017
Indicators value changes by year
Minimum:
67.356
jan 1, 1961
Maximum:
86.507
jan 1, 2000
At the date of observation
Value
Absolute change
Change from previous value
jan 1, 1961
67.356
+67.356
0.0%
jan 1, 1962
69.295
+1.94
2.88%
jan 1, 1963
68.98
-0.316
-0.46%
jan 1, 1964
70.835
+1.855
2.69%
jan 1, 1965
71.454
+0.619
0.87%
jan 1, 1966
71.591
+0.137
0.19%
jan 1, 1967
70.494
-1.097
-1.53%
jan 1, 1968
72.466
+1.972
2.8%
jan 1, 1969
73.168
+0.702
0.97%
jan 1, 1970
74.703
+1.535
2.1%
jan 1, 1971
78.366
+3.663
4.9%
jan 1, 1972
80.114
+1.748
2.23%
jan 1, 1973
80.421
+0.307
0.38%
jan 1, 1974
81.616
+1.194
1.49%
jan 1, 1975
81.904
+0.288
0.35%
jan 1, 1976
84.246
+2.342
2.86%
jan 1, 1977
85.374
+1.128
1.34%
jan 1, 1978
81.548
-3.826
-4.48%
jan 1, 1979
81.259
-0.289
-0.35%
jan 1, 1980
82.18
+0.922
1.13%
jan 1, 1981
84.322
+2.142
2.61%
jan 1, 1982
85.404
+1.082
1.28%
jan 1, 1983
85.285
-0.119
-0.14%
jan 1, 1984
85.334
+0.049
0.06%
jan 1, 1985
84.55
-0.784
-0.92%
jan 1, 1986
81.404
-3.146
-3.72%
jan 1, 1987
84.219
+2.814
3.46%
jan 1, 1988
83.112
-1.107
-1.31%
jan 1, 1989
82.133
-0.979
-1.18%
jan 1, 1990
84.227
+2.094
2.55%
jan 1, 1991
80.447
-3.78
-4.49%
jan 1, 1992
80.597
+0.15
0.19%
jan 1, 1993
83.563
+2.967
3.68%
jan 1, 1994
81.962
-1.602
-1.92%
jan 1, 1995
80.822
-1.139
-1.39%
jan 1, 1996
83.178
+2.356
2.92%
jan 1, 1997
80.552
-2.626
-3.16%
jan 1, 1998
81.022
+0.47
0.58%
jan 1, 1999
83.497
+2.475
3.05%
jan 1, 2000
86.507
+3.01
3.6%
jan 1, 2001
84.036
-2.471
-2.86%
jan 1, 2002
83.385
-0.651
-0.77%
jan 1, 2003
85.257
+1.871
2.24%
jan 1, 2004
81.773
-3.483
-4.09%
jan 1, 2005
82.756
+0.983
1.2%
jan 1, 2006
84.122
+1.366
1.65%
jan 1, 2007
80.816
-3.306
-3.93%
jan 1, 2008
79.241
-1.575
-1.95%
jan 1, 2009
78.637
-0.604
-0.76%
jan 1, 2010
78.088
-0.549
-0.7%
jan 1, 2011
75.127
-2.961
-3.79%
jan 1, 2012
75.659
+0.532
0.71%
jan 1, 2013
75.113
-0.546
-0.72%
jan 1, 2014
73.692
-1.421
-1.89%
jan 1, 2015
74.259
+0.566
0.77%
Ranking of countries by current statistics by years


Comments: