29
/
en
AIzaSyAYiBZKx7MnpbEhh9jyipgxe19OcubqV5w
April 1, 2024
105972
China
CHN
true
2
1
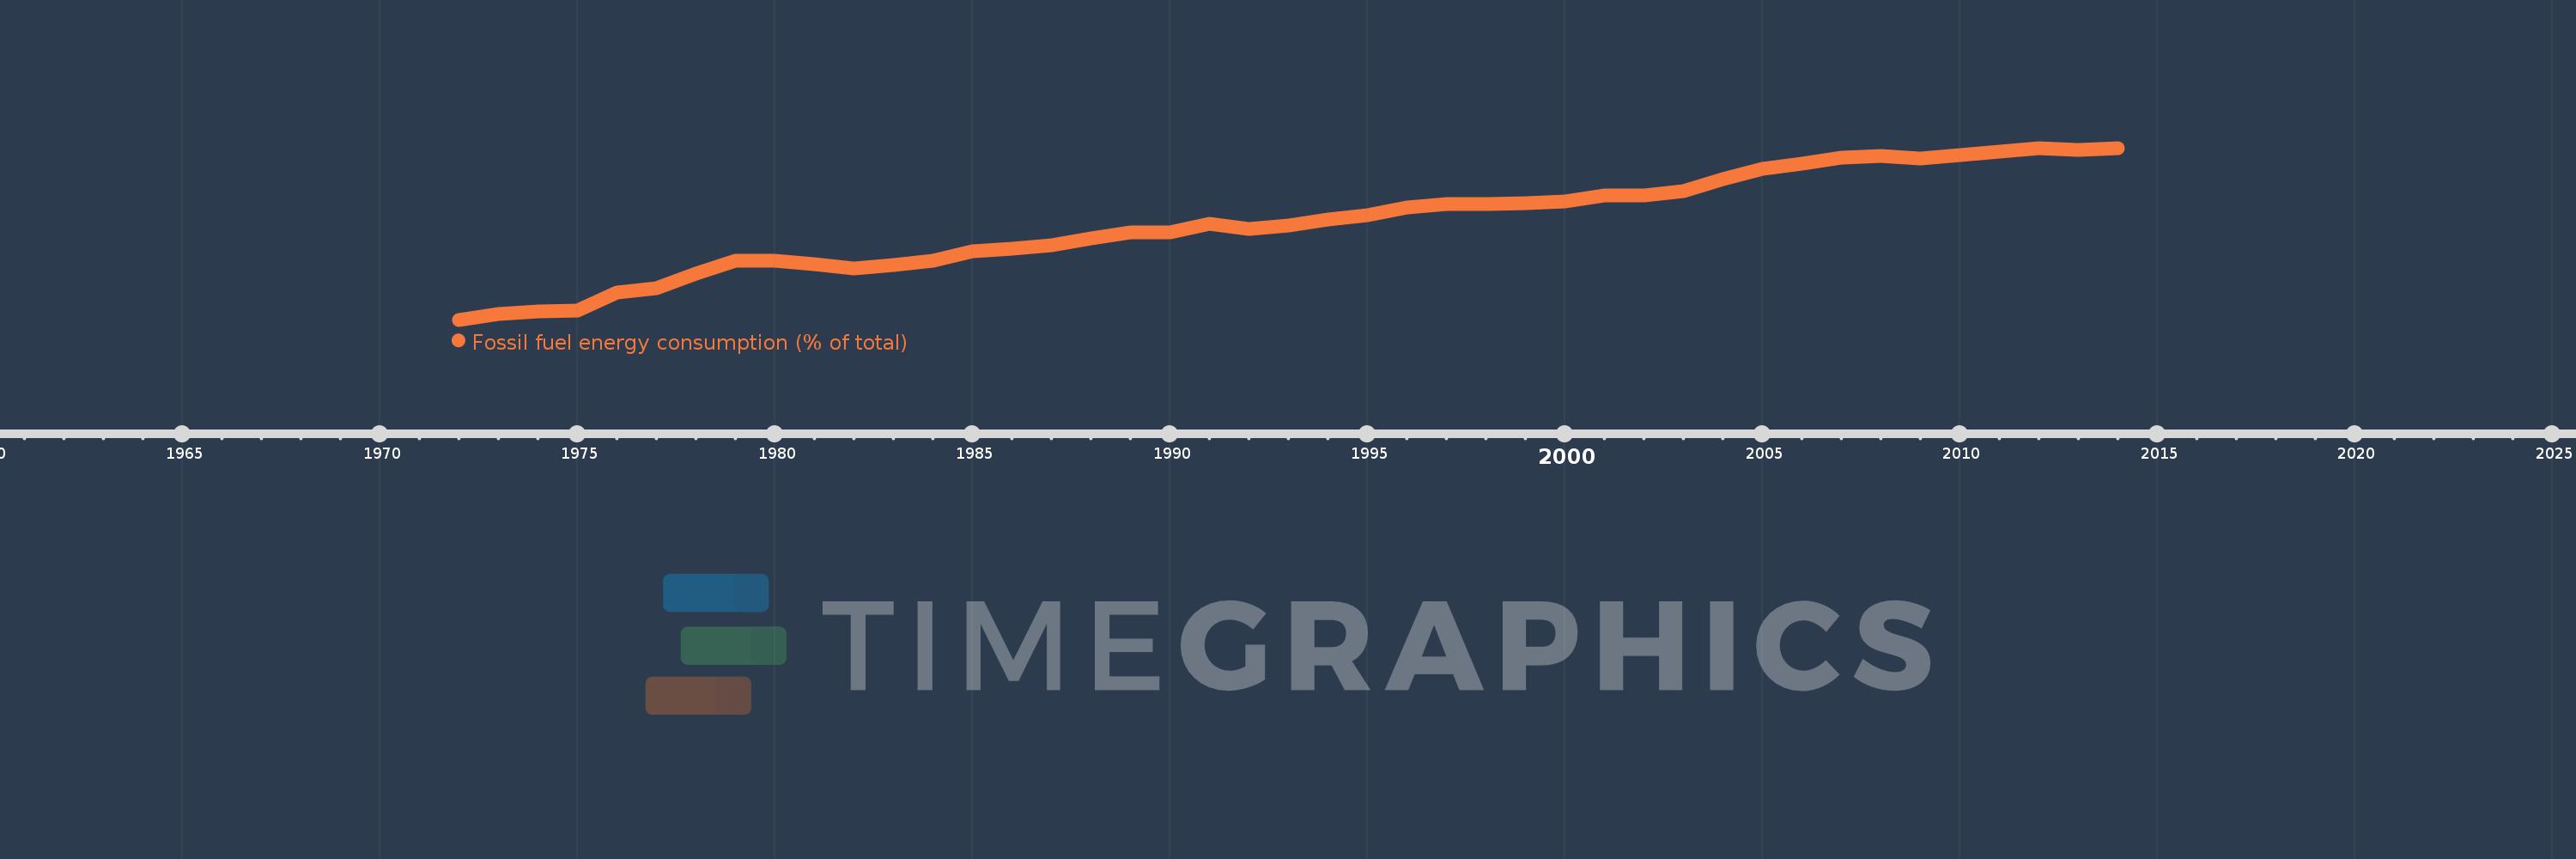
Fossil fuel energy consumption (% of total)
2014,2013,2012,2011,2010,2009,2008,2007,2006,2005,2004,2003,2002,2001,2000,1999,1998,1997,1996,1995,1994,1993,1992,1991,1990,1989,1988,1987,1986,1985,1984,1983,1982,1981,1980,1979,1978,1977,1976,1975,1974,1973,1972
This statistics in other country:
AlbaniaAlgeriaAngolaAntigua and BarbudaArab WorldArgentinaArmeniaAustraliaAustriaAzerbaijanBahamas, TheBahrainBangladeshBarbadosBelarusBelgiumBelizeBeninBhutanBoliviaBosnia and HerzegovinaBotswanaBrazilBrunei DarussalamBulgariaCabo VerdeCambodiaCameroonCanadaCaribbean small statesCentral Europe and the BalticsChileChinaColombiaComorosCongo, Dem. Rep.Congo, Rep.Costa RicaCote d'IvoireCroatiaCubaCuracaoCyprusCzech RepublicDenmarkDjiboutiDominicaDominican RepublicEarly-demographic dividendEast Asia & PacificEast Asia & Pacific (excluding high income)East Asia & Pacific (IDA & IBRD countries)EcuadorEgypt, Arab Rep.El SalvadorEquatorial GuineaEritreaEstoniaEthiopiaEuro areaEurope & Central AsiaEurope & Central Asia (excluding high income)Europe & Central Asia (IDA & IBRD countries)European UnionFijiFinlandFragile and conflict affected situationsFranceGabonGambia, TheGeorgiaGermanyGhanaGibraltarGreeceGrenadaGuatemalaGuinea-BissauGuyanaHaitiHeavily indebted poor countries (HIPC)High incomeHondurasHong Kong SAR, ChinaHungaryIBRD onlyIcelandIDA & IBRD totalIDA blendIDA onlyIDA totalIndiaIndonesiaIran, Islamic Rep.IraqIrelandIsraelItalyJamaicaJapanJordanKazakhstanKenyaKiribatiKorea, Dem. People’s Rep.Korea, Rep.KosovoKuwaitKyrgyz RepublicLate-demographic dividendLatin America & Caribbean Latin America & Caribbean (excluding high income)Latin America & the Caribbean (IDA & IBRD countries)LatviaLeast developed countries: UN classificationLebanonLesothoLibyaLithuaniaLow & middle incomeLow incomeLower middle incomeLuxembourgMacedonia, FYRMalaysiaMaldivesMaltaMarshall IslandsMauritiusMexicoMiddle East & North AfricaMiddle East & North Africa (excluding high income)Middle East & North Africa (IDA & IBRD countries)Middle incomeMoldovaMongoliaMontenegroMoroccoMozambiqueMyanmarNamibiaNepalNetherlandsNew ZealandNicaraguaNigerNigeriaNorth AmericaNorwayOECD membersOmanOther small statesPacific island small statesPakistanPalauPanamaParaguayPeruPhilippinesPolandPortugalPost-demographic dividendPre-demographic dividendQatarRomaniaRussian FederationSamoaSao Tome and PrincipeSaudi ArabiaSenegalSerbiaSeychellesSingaporeSlovak RepublicSloveniaSmall statesSolomon IslandsSouth AfricaSouth AsiaSouth Asia (IDA & IBRD)South SudanSpainSri LankaSt. Kitts and NevisSt. LuciaSt. Vincent and the GrenadinesSub-Saharan Africa Sub-Saharan Africa (excluding high income)Sub-Saharan Africa (IDA & IBRD countries)SudanSurinameSwazilandSwedenSwitzerlandSyrian Arab RepublicTajikistanTanzaniaThailandTimor-LesteTogoTongaTrinidad and TobagoTunisiaTurkeyUkraineUnited Arab EmiratesUnited KingdomUnited StatesUpper middle incomeUruguayUzbekistanVanuatuVenezuela, RBVietnamWorldYemen, Rep.ZambiaZimbabwe Timeline:
This timeline shows a graph from 1972 to 2014 of China. No data until 1971. Number of actual observations by date: 43.
Source name:
World Development Indicators
Source organization:
IEA Statistics © OECD/IEA 2014 (http://www.iea.org/stats/index.asp), subject to https://www.iea.org/t&c/termsandconditions/
Categories, topics:
Energy & Mining
Last updated:
apr 23, 2017
Indicators value changes by year
Minimum:
59.899
jan 1, 1972
Maximum:
88.178
jan 1, 2012
At the date of observation
Value
Absolute change
Change from previous value
jan 1, 1972
59.899
+59.899
0.0%
jan 1, 1973
60.86
+0.96
1.6%
jan 1, 1974
61.325
+0.465
0.76%
jan 1, 1975
61.437
+0.112
0.18%
jan 1, 1976
64.436
+2.999
4.88%
jan 1, 1977
65.079
+0.643
1.0%
jan 1, 1978
67.479
+2.4
3.69%
jan 1, 1979
69.637
+2.158
3.2%
jan 1, 1980
69.66
+0.022
0.03%
jan 1, 1981
69.075
-0.585
-0.84%
jan 1, 1982
68.381
-0.693
-1.0%
jan 1, 1983
68.873
+0.492
0.72%
jan 1, 1984
69.606
+0.733
1.06%
jan 1, 1985
71.164
+1.557
2.24%
jan 1, 1986
71.567
+0.404
0.57%
jan 1, 1987
72.225
+0.657
0.92%
jan 1, 1988
73.236
+1.011
1.4%
jan 1, 1989
74.235
+1.0
1.36%
jan 1, 1990
74.317
+0.082
0.11%
jan 1, 1991
75.709
+1.392
1.87%
jan 1, 1992
74.832
-0.877
-1.16%
jan 1, 1993
75.432
+0.6
0.8%
jan 1, 1994
76.469
+1.037
1.37%
jan 1, 1995
77.045
+0.576
0.75%
jan 1, 1996
78.427
+1.382
1.79%
jan 1, 1997
78.996
+0.57
0.73%
jan 1, 1998
78.945
-0.051
-0.06%
jan 1, 1999
79.017
+0.071
0.09%
jan 1, 2000
79.43
+0.413
0.52%
jan 1, 2001
80.334
+0.904
1.14%
jan 1, 2002
80.329
-0.005
-0.01%
jan 1, 2003
81.132
+0.803
1.0%
jan 1, 2004
83.11
+1.978
2.44%
jan 1, 2005
84.792
+1.683
2.02%
jan 1, 2006
85.575
+0.782
0.92%
jan 1, 2007
86.528
+0.953
1.11%
jan 1, 2008
86.793
+0.265
0.31%
jan 1, 2009
86.466
-0.327
-0.38%
jan 1, 2010
87.029
+0.563
0.65%
jan 1, 2011
87.521
+0.492
0.57%
jan 1, 2012
88.178
+0.657
0.75%
jan 1, 2013
87.907
-0.271
-0.31%
jan 1, 2014
88.137
+0.23
0.26%
Ranking of countries by current statistics by years


Comments: