29
/
en
AIzaSyAYiBZKx7MnpbEhh9jyipgxe19OcubqV5w
April 1, 2024
38980
IDA only
IDX
false
2
1
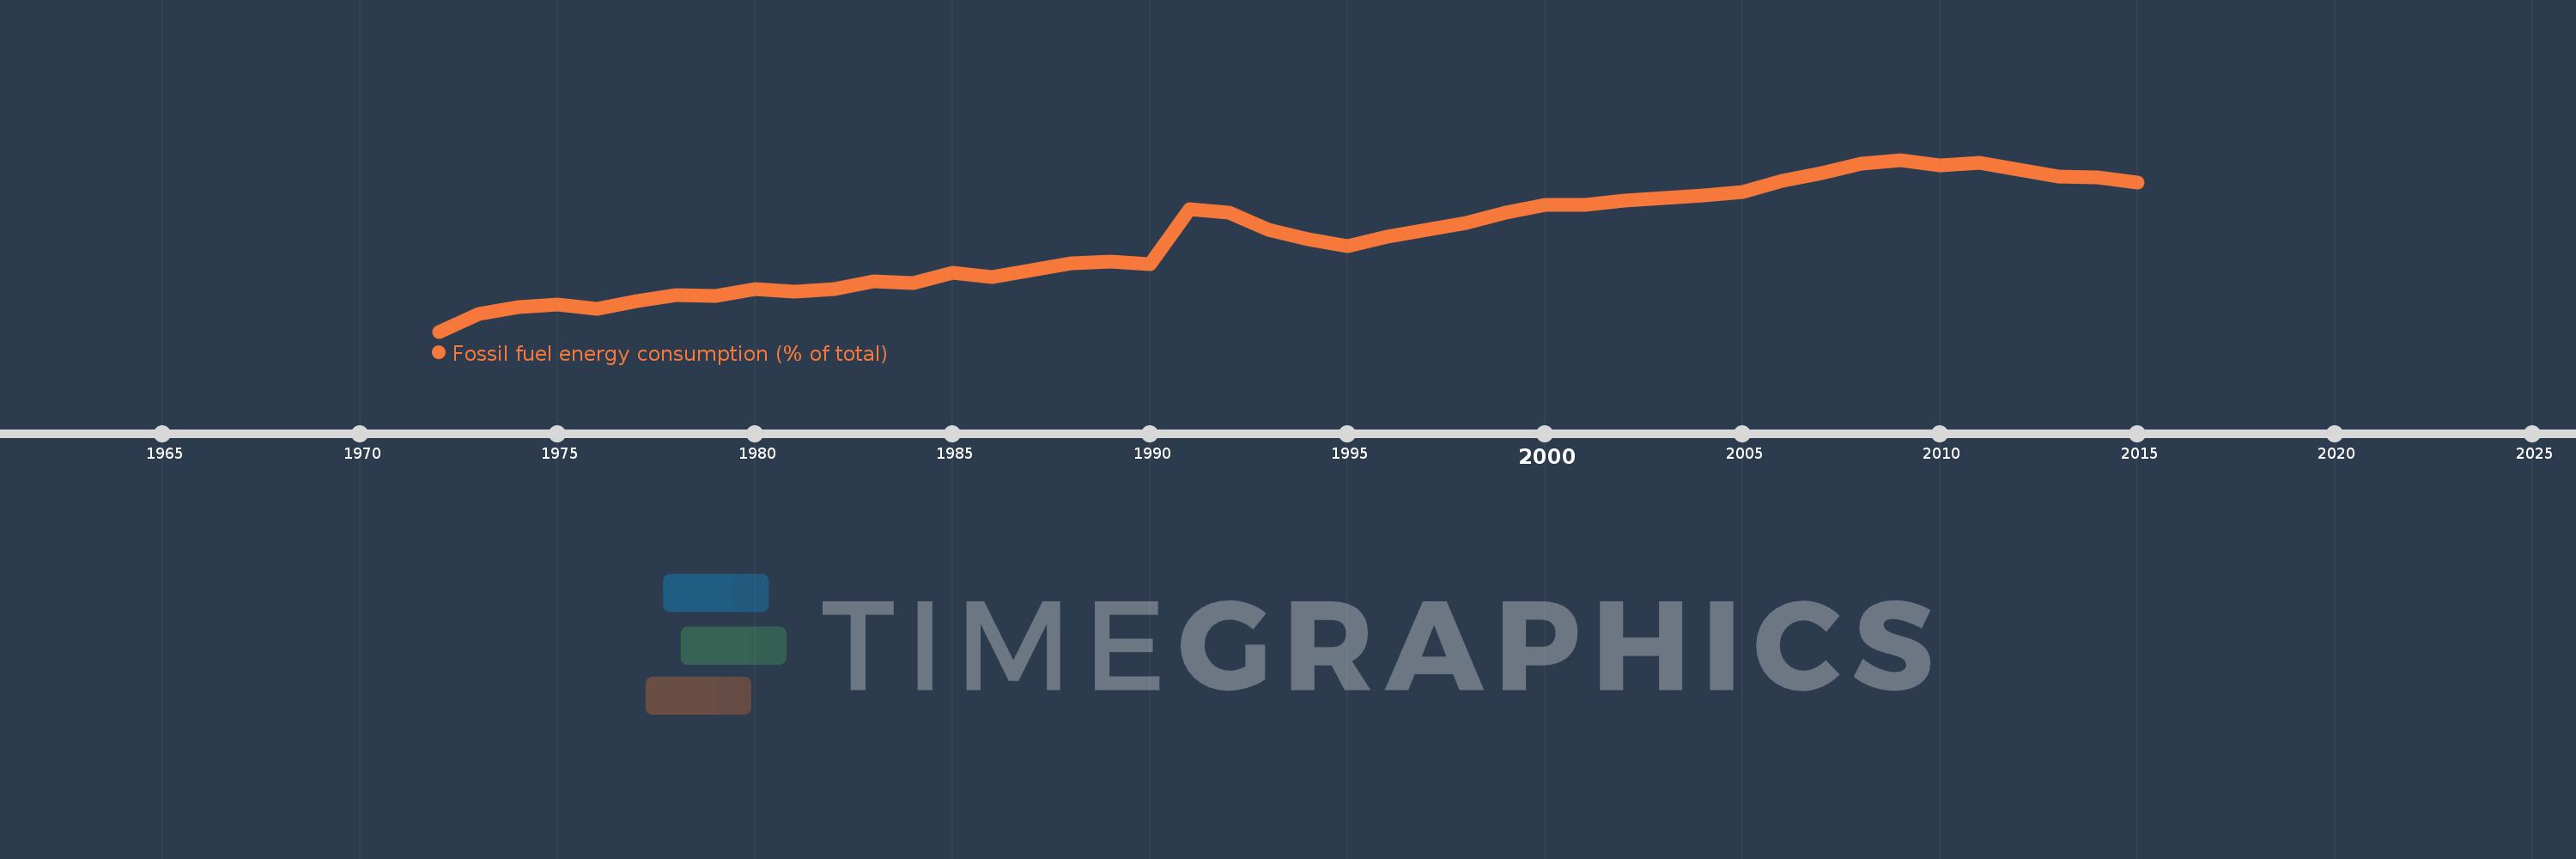
Fossil fuel energy consumption (% of total)
2015,2014,2013,2012,2011,2010,2009,2008,2007,2006,2005,2004,2003,2002,2001,2000,1999,1998,1997,1996,1995,1994,1993,1992,1991,1990,1989,1988,1987,1986,1985,1984,1983,1982,1981,1980,1979,1978,1977,1976,1975,1974,1973,1972
This statistics in other country:
AlbaniaAlgeriaAngolaAntigua and BarbudaArab WorldArgentinaArmeniaAustraliaAustriaAzerbaijanBahamas, TheBahrainBangladeshBarbadosBelarusBelgiumBelizeBeninBhutanBoliviaBosnia and HerzegovinaBotswanaBrazilBrunei DarussalamBulgariaCabo VerdeCambodiaCameroonCanadaCaribbean small statesCentral Europe and the BalticsChileChinaColombiaComorosCongo, Dem. Rep.Congo, Rep.Costa RicaCote d'IvoireCroatiaCubaCuracaoCyprusCzech RepublicDenmarkDjiboutiDominicaDominican RepublicEarly-demographic dividendEast Asia & PacificEast Asia & Pacific (excluding high income)East Asia & Pacific (IDA & IBRD countries)EcuadorEgypt, Arab Rep.El SalvadorEquatorial GuineaEritreaEstoniaEthiopiaEuro areaEurope & Central AsiaEurope & Central Asia (excluding high income)Europe & Central Asia (IDA & IBRD countries)European UnionFijiFinlandFragile and conflict affected situationsFranceGabonGambia, TheGeorgiaGermanyGhanaGibraltarGreeceGrenadaGuatemalaGuinea-BissauGuyanaHaitiHeavily indebted poor countries (HIPC)High incomeHondurasHong Kong SAR, ChinaHungaryIBRD onlyIcelandIDA & IBRD totalIDA blendIDA onlyIDA totalIndiaIndonesiaIran, Islamic Rep.IraqIrelandIsraelItalyJamaicaJapanJordanKazakhstanKenyaKiribatiKorea, Dem. People’s Rep.Korea, Rep.KosovoKuwaitKyrgyz RepublicLate-demographic dividendLatin America & Caribbean Latin America & Caribbean (excluding high income)Latin America & the Caribbean (IDA & IBRD countries)LatviaLeast developed countries: UN classificationLebanonLesothoLibyaLithuaniaLow & middle incomeLow incomeLower middle incomeLuxembourgMacedonia, FYRMalaysiaMaldivesMaltaMarshall IslandsMauritiusMexicoMiddle East & North AfricaMiddle East & North Africa (excluding high income)Middle East & North Africa (IDA & IBRD countries)Middle incomeMoldovaMongoliaMontenegroMoroccoMozambiqueMyanmarNamibiaNepalNetherlandsNew ZealandNicaraguaNigerNigeriaNorth AmericaNorwayOECD membersOmanOther small statesPacific island small statesPakistanPalauPanamaParaguayPeruPhilippinesPolandPortugalPost-demographic dividendPre-demographic dividendQatarRomaniaRussian FederationSamoaSao Tome and PrincipeSaudi ArabiaSenegalSerbiaSeychellesSingaporeSlovak RepublicSloveniaSmall statesSolomon IslandsSouth AfricaSouth AsiaSouth Asia (IDA & IBRD)South SudanSpainSri LankaSt. Kitts and NevisSt. LuciaSt. Vincent and the GrenadinesSub-Saharan Africa Sub-Saharan Africa (excluding high income)Sub-Saharan Africa (IDA & IBRD countries)SudanSurinameSwazilandSwedenSwitzerlandSyrian Arab RepublicTajikistanTanzaniaThailandTimor-LesteTogoTongaTrinidad and TobagoTunisiaTurkeyUkraineUnited Arab EmiratesUnited KingdomUnited StatesUpper middle incomeUruguayUzbekistanVanuatuVenezuela, RBVietnamWorldYemen, Rep.ZambiaZimbabwe Timeline:
This timeline shows a graph from 1972 to 2015 of IDA only. No data until 1971. Number of actual observations by date: 44.
Source name:
World Development Indicators
Source organization:
IEA Statistics © OECD/IEA 2014 (http://www.iea.org/stats/index.asp), subject to https://www.iea.org/t&c/termsandconditions/
Categories, topics:
Energy & Mining
Last updated:
apr 23, 2017
Indicators value changes by year
Minimum:
15.907
jan 1, 1972
Maximum:
33.394
jan 1, 2009
At the date of observation
Value
Absolute change
Change from previous value
jan 1, 1972
15.907
+15.907
0.0%
jan 1, 1973
17.704
+1.797
11.3%
jan 1, 1974
18.382
+0.678
3.83%
jan 1, 1975
18.672
+0.29
1.58%
jan 1, 1976
18.181
-0.49
-2.63%
jan 1, 1977
19.026
+0.845
4.65%
jan 1, 1978
19.587
+0.56
2.94%
jan 1, 1979
19.579
-0.008
-0.04%
jan 1, 1980
20.193
+0.614
3.13%
jan 1, 1981
20.014
-0.179
-0.89%
jan 1, 1982
20.203
+0.189
0.95%
jan 1, 1983
21.007
+0.804
3.98%
jan 1, 1984
20.833
-0.173
-0.82%
jan 1, 1985
21.894
+1.061
5.09%
jan 1, 1986
21.425
-0.469
-2.14%
jan 1, 1987
22.194
+0.769
3.59%
jan 1, 1988
22.821
+0.628
2.83%
jan 1, 1989
23.024
+0.202
0.89%
jan 1, 1990
22.753
-0.27
-1.17%
jan 1, 1991
28.337
+5.584
24.54%
jan 1, 1992
27.981
-0.356
-1.26%
jan 1, 1993
26.311
-1.671
-5.97%
jan 1, 1994
25.347
-0.964
-3.66%
jan 1, 1995
24.596
-0.751
-2.96%
jan 1, 1996
25.525
+0.929
3.78%
jan 1, 1997
26.272
+0.748
2.93%
jan 1, 1998
26.932
+0.659
2.51%
jan 1, 1999
28.015
+1.084
4.02%
jan 1, 2000
28.782
+0.767
2.74%
jan 1, 2001
28.84
+0.058
0.2%
jan 1, 2002
29.2
+0.36
1.25%
jan 1, 2003
29.51
+0.31
1.06%
jan 1, 2004
29.736
+0.226
0.77%
jan 1, 2005
30.112
+0.376
1.26%
jan 1, 2006
31.243
+1.131
3.76%
jan 1, 2007
32.002
+0.759
2.43%
jan 1, 2008
32.962
+0.96
3.0%
jan 1, 2009
33.394
+0.432
1.31%
jan 1, 2010
32.851
-0.543
-1.63%
jan 1, 2011
33.111
+0.26
0.79%
jan 1, 2012
32.397
-0.714
-2.16%
jan 1, 2013
31.65
-0.747
-2.31%
jan 1, 2014
31.601
-0.049
-0.15%
jan 1, 2015
31.049
-0.553
-1.75%
Ranking of countries by current statistics by years


Comments: