29
/
en
AIzaSyAYiBZKx7MnpbEhh9jyipgxe19OcubqV5w
April 1, 2024
195538
Mexico
MEX
true
2
1
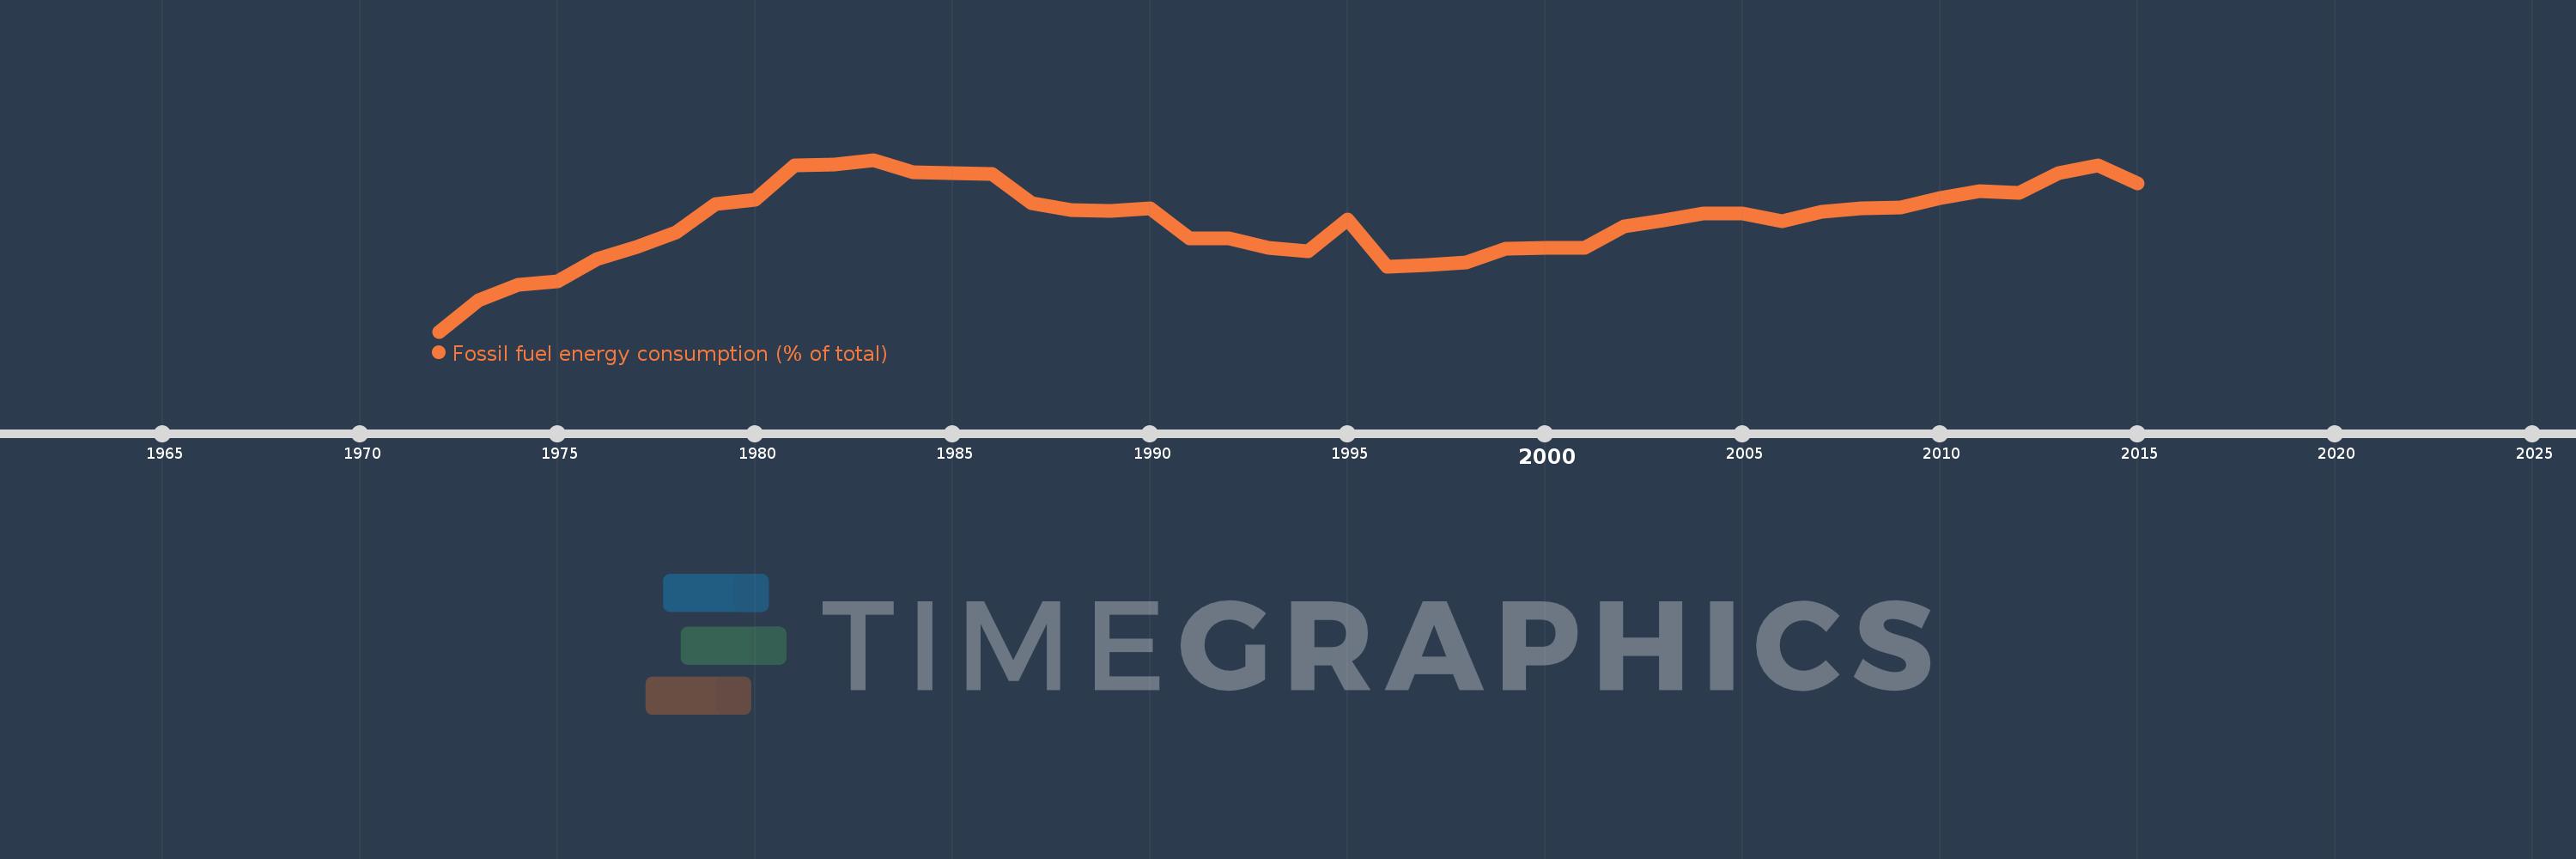
Fossil fuel energy consumption (% of total)
2015,2014,2013,2012,2011,2010,2009,2008,2007,2006,2005,2004,2003,2002,2001,2000,1999,1998,1997,1996,1995,1994,1993,1992,1991,1990,1989,1988,1987,1986,1985,1984,1983,1982,1981,1980,1979,1978,1977,1976,1975,1974,1973,1972
This statistics in other country:
AlbaniaAlgeriaAngolaAntigua and BarbudaArab WorldArgentinaArmeniaAustraliaAustriaAzerbaijanBahamas, TheBahrainBangladeshBarbadosBelarusBelgiumBelizeBeninBhutanBoliviaBosnia and HerzegovinaBotswanaBrazilBrunei DarussalamBulgariaCabo VerdeCambodiaCameroonCanadaCaribbean small statesCentral Europe and the BalticsChileChinaColombiaComorosCongo, Dem. Rep.Congo, Rep.Costa RicaCote d'IvoireCroatiaCubaCuracaoCyprusCzech RepublicDenmarkDjiboutiDominicaDominican RepublicEarly-demographic dividendEast Asia & PacificEast Asia & Pacific (excluding high income)East Asia & Pacific (IDA & IBRD countries)EcuadorEgypt, Arab Rep.El SalvadorEquatorial GuineaEritreaEstoniaEthiopiaEuro areaEurope & Central AsiaEurope & Central Asia (excluding high income)Europe & Central Asia (IDA & IBRD countries)European UnionFijiFinlandFragile and conflict affected situationsFranceGabonGambia, TheGeorgiaGermanyGhanaGibraltarGreeceGrenadaGuatemalaGuinea-BissauGuyanaHaitiHeavily indebted poor countries (HIPC)High incomeHondurasHong Kong SAR, ChinaHungaryIBRD onlyIcelandIDA & IBRD totalIDA blendIDA onlyIDA totalIndiaIndonesiaIran, Islamic Rep.IraqIrelandIsraelItalyJamaicaJapanJordanKazakhstanKenyaKiribatiKorea, Dem. People’s Rep.Korea, Rep.KosovoKuwaitKyrgyz RepublicLate-demographic dividendLatin America & Caribbean Latin America & Caribbean (excluding high income)Latin America & the Caribbean (IDA & IBRD countries)LatviaLeast developed countries: UN classificationLebanonLesothoLibyaLithuaniaLow & middle incomeLow incomeLower middle incomeLuxembourgMacedonia, FYRMalaysiaMaldivesMaltaMarshall IslandsMauritiusMexicoMiddle East & North AfricaMiddle East & North Africa (excluding high income)Middle East & North Africa (IDA & IBRD countries)Middle incomeMoldovaMongoliaMontenegroMoroccoMozambiqueMyanmarNamibiaNepalNetherlandsNew ZealandNicaraguaNigerNigeriaNorth AmericaNorwayOECD membersOmanOther small statesPacific island small statesPakistanPalauPanamaParaguayPeruPhilippinesPolandPortugalPost-demographic dividendPre-demographic dividendQatarRomaniaRussian FederationSamoaSao Tome and PrincipeSaudi ArabiaSenegalSerbiaSeychellesSingaporeSlovak RepublicSloveniaSmall statesSolomon IslandsSouth AfricaSouth AsiaSouth Asia (IDA & IBRD)South SudanSpainSri LankaSt. Kitts and NevisSt. LuciaSt. Vincent and the GrenadinesSub-Saharan Africa Sub-Saharan Africa (excluding high income)Sub-Saharan Africa (IDA & IBRD countries)SudanSurinameSwazilandSwedenSwitzerlandSyrian Arab RepublicTajikistanTanzaniaThailandTimor-LesteTogoTongaTrinidad and TobagoTunisiaTurkeyUkraineUnited Arab EmiratesUnited KingdomUnited StatesUpper middle incomeUruguayUzbekistanVanuatuVenezuela, RBVietnamWorldYemen, Rep.ZambiaZimbabwe Timeline:
This timeline shows a graph from 1972 to 2015 of Mexico. No data until 1971. Number of actual observations by date: 44.
Source name:
World Development Indicators
Source organization:
IEA Statistics © OECD/IEA 2014 (http://www.iea.org/stats/index.asp), subject to https://www.iea.org/t&c/termsandconditions/
Categories, topics:
Energy & Mining
Last updated:
apr 23, 2017
Indicators value changes by year
Minimum:
83.192
jan 1, 1972
Maximum:
90.613
jan 1, 1983
At the date of observation
Value
Absolute change
Change from previous value
jan 1, 1972
83.192
+83.192
0.0%
jan 1, 1973
84.552
+1.359
1.63%
jan 1, 1974
85.224
+0.672
0.79%
jan 1, 1975
85.367
+0.144
0.17%
jan 1, 1976
86.339
+0.971
1.14%
jan 1, 1977
86.856
+0.518
0.6%
jan 1, 1978
87.467
+0.611
0.7%
jan 1, 1979
88.719
+1.251
1.43%
jan 1, 1980
88.903
+0.185
0.21%
jan 1, 1981
90.36
+1.457
1.64%
jan 1, 1982
90.4
+0.04
0.04%
jan 1, 1983
90.613
+0.213
0.24%
jan 1, 1984
90.087
-0.526
-0.58%
jan 1, 1985
90.036
-0.051
-0.06%
jan 1, 1986
90.017
-0.019
-0.02%
jan 1, 1987
88.748
-1.27
-1.41%
jan 1, 1988
88.444
-0.304
-0.34%
jan 1, 1989
88.414
-0.03
-0.03%
jan 1, 1990
88.527
+0.113
0.13%
jan 1, 1991
87.232
-1.295
-1.46%
jan 1, 1992
87.227
-0.005
-0.01%
jan 1, 1993
86.803
-0.423
-0.49%
jan 1, 1994
86.654
-0.149
-0.17%
jan 1, 1995
88.038
+1.384
1.6%
jan 1, 1996
85.99
-2.048
-2.33%
jan 1, 1997
86.069
+0.079
0.09%
jan 1, 1998
86.197
+0.128
0.15%
jan 1, 1999
86.776
+0.579
0.67%
jan 1, 2000
86.815
+0.039
0.05%
jan 1, 2001
86.793
-0.022
-0.03%
jan 1, 2002
87.74
+0.947
1.09%
jan 1, 2003
87.992
+0.252
0.29%
jan 1, 2004
88.276
+0.284
0.32%
jan 1, 2005
88.302
+0.026
0.03%
jan 1, 2006
87.945
-0.357
-0.4%
jan 1, 2007
88.354
+0.409
0.46%
jan 1, 2008
88.521
+0.168
0.19%
jan 1, 2009
88.55
+0.028
0.03%
jan 1, 2010
88.962
+0.412
0.47%
jan 1, 2011
89.266
+0.304
0.34%
jan 1, 2012
89.191
-0.075
-0.08%
jan 1, 2013
90.023
+0.831
0.93%
jan 1, 2014
90.38
+0.357
0.4%
jan 1, 2015
89.602
-0.778
-0.86%
Ranking of countries by current statistics by years


Comments: