29
/
en
AIzaSyAYiBZKx7MnpbEhh9jyipgxe19OcubqV5w
April 1, 2024
141796
Greece
GRC
true
2
1
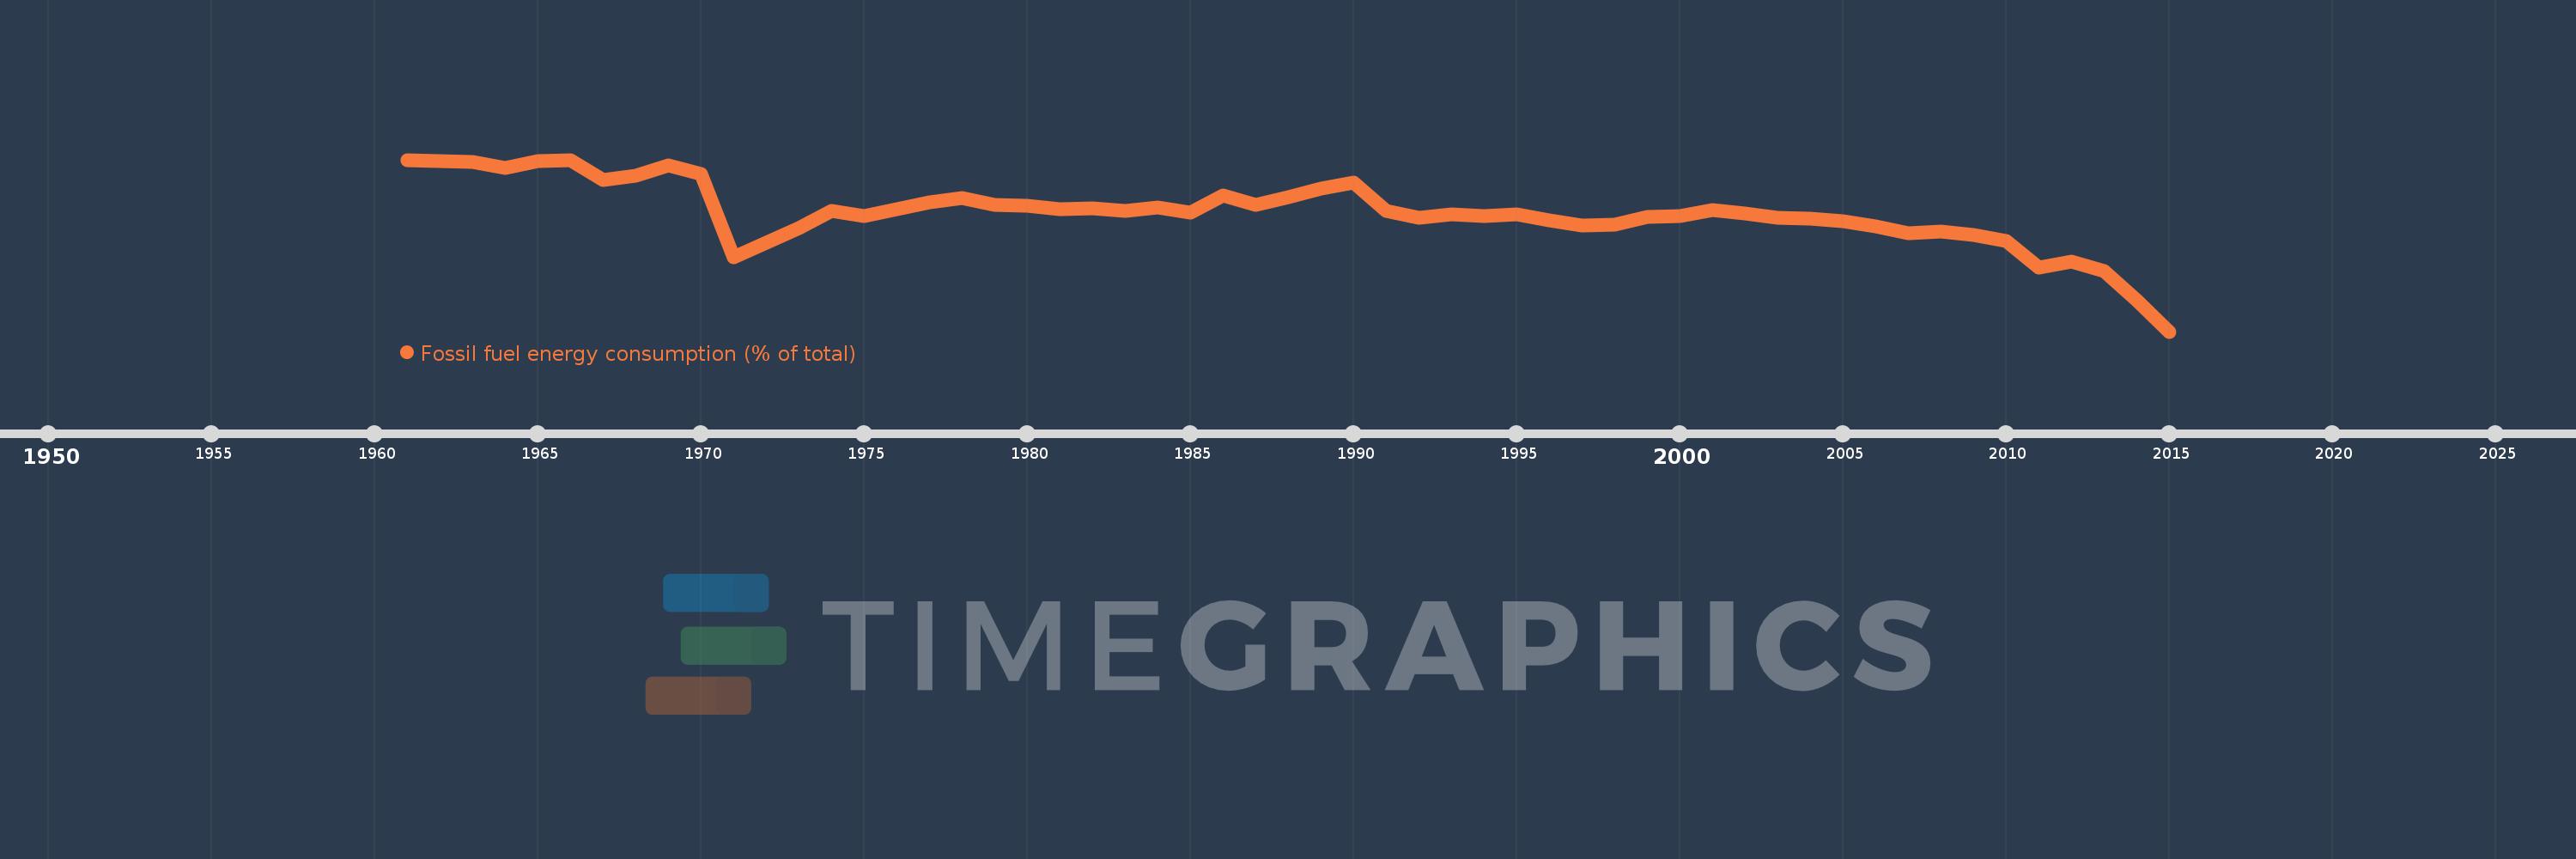
Fossil fuel energy consumption (% of total)
2015,2014,2013,2012,2011,2010,2009,2008,2007,2006,2005,2004,2003,2002,2001,2000,1999,1998,1997,1996,1995,1994,1993,1992,1991,1990,1989,1988,1987,1986,1985,1984,1983,1982,1981,1980,1979,1978,1977,1976,1975,1974,1973,1972,1971,1970,1969,1968,1967,1966,1965,1964,1963,1962,1961
This statistics in other country:
AlbaniaAlgeriaAngolaAntigua and BarbudaArab WorldArgentinaArmeniaAustraliaAustriaAzerbaijanBahamas, TheBahrainBangladeshBarbadosBelarusBelgiumBelizeBeninBhutanBoliviaBosnia and HerzegovinaBotswanaBrazilBrunei DarussalamBulgariaCabo VerdeCambodiaCameroonCanadaCaribbean small statesCentral Europe and the BalticsChileChinaColombiaComorosCongo, Dem. Rep.Congo, Rep.Costa RicaCote d'IvoireCroatiaCubaCuracaoCyprusCzech RepublicDenmarkDjiboutiDominicaDominican RepublicEarly-demographic dividendEast Asia & PacificEast Asia & Pacific (excluding high income)East Asia & Pacific (IDA & IBRD countries)EcuadorEgypt, Arab Rep.El SalvadorEquatorial GuineaEritreaEstoniaEthiopiaEuro areaEurope & Central AsiaEurope & Central Asia (excluding high income)Europe & Central Asia (IDA & IBRD countries)European UnionFijiFinlandFragile and conflict affected situationsFranceGabonGambia, TheGeorgiaGermanyGhanaGibraltarGreeceGrenadaGuatemalaGuinea-BissauGuyanaHaitiHeavily indebted poor countries (HIPC)High incomeHondurasHong Kong SAR, ChinaHungaryIBRD onlyIcelandIDA & IBRD totalIDA blendIDA onlyIDA totalIndiaIndonesiaIran, Islamic Rep.IraqIrelandIsraelItalyJamaicaJapanJordanKazakhstanKenyaKiribatiKorea, Dem. People’s Rep.Korea, Rep.KosovoKuwaitKyrgyz RepublicLate-demographic dividendLatin America & Caribbean Latin America & Caribbean (excluding high income)Latin America & the Caribbean (IDA & IBRD countries)LatviaLeast developed countries: UN classificationLebanonLesothoLibyaLithuaniaLow & middle incomeLow incomeLower middle incomeLuxembourgMacedonia, FYRMalaysiaMaldivesMaltaMarshall IslandsMauritiusMexicoMiddle East & North AfricaMiddle East & North Africa (excluding high income)Middle East & North Africa (IDA & IBRD countries)Middle incomeMoldovaMongoliaMontenegroMoroccoMozambiqueMyanmarNamibiaNepalNetherlandsNew ZealandNicaraguaNigerNigeriaNorth AmericaNorwayOECD membersOmanOther small statesPacific island small statesPakistanPalauPanamaParaguayPeruPhilippinesPolandPortugalPost-demographic dividendPre-demographic dividendQatarRomaniaRussian FederationSamoaSao Tome and PrincipeSaudi ArabiaSenegalSerbiaSeychellesSingaporeSlovak RepublicSloveniaSmall statesSolomon IslandsSouth AfricaSouth AsiaSouth Asia (IDA & IBRD)South SudanSpainSri LankaSt. Kitts and NevisSt. LuciaSt. Vincent and the GrenadinesSub-Saharan Africa Sub-Saharan Africa (excluding high income)Sub-Saharan Africa (IDA & IBRD countries)SudanSurinameSwazilandSwedenSwitzerlandSyrian Arab RepublicTajikistanTanzaniaThailandTimor-LesteTogoTongaTrinidad and TobagoTunisiaTurkeyUkraineUnited Arab EmiratesUnited KingdomUnited StatesUpper middle incomeUruguayUzbekistanVanuatuVenezuela, RBVietnamWorldYemen, Rep.ZambiaZimbabwe Timeline:
This timeline shows a graph from 1961 to 2015 of Greece. No data until 1960. Number of actual observations by date: 55.
Source name:
World Development Indicators
Source organization:
IEA Statistics © OECD/IEA 2014 (http://www.iea.org/stats/index.asp), subject to https://www.iea.org/t&c/termsandconditions/
Categories, topics:
Energy & Mining
Last updated:
apr 23, 2017
Indicators value changes by year
Minimum:
85.676
jan 1, 2015
Maximum:
98.311
jan 1, 1961
At the date of observation
Value
Absolute change
Change from previous value
jan 1, 1961
98.311
+98.311
0.0%
jan 1, 1962
98.2
-0.111
-0.11%
jan 1, 1963
98.125
-0.075
-0.08%
jan 1, 1964
97.681
-0.444
-0.45%
jan 1, 1965
98.194
+0.513
0.52%
jan 1, 1966
98.271
+0.077
0.08%
jan 1, 1967
96.827
-1.444
-1.47%
jan 1, 1968
97.114
+0.287
0.3%
jan 1, 1969
97.906
+0.792
0.82%
jan 1, 1970
97.287
-0.619
-0.63%
jan 1, 1971
91.159
-6.128
-6.3%
jan 1, 1972
92.203
+1.044
1.15%
jan 1, 1973
93.262
+1.059
1.15%
jan 1, 1974
94.539
+1.277
1.37%
jan 1, 1975
94.181
-0.358
-0.38%
jan 1, 1976
94.688
+0.507
0.54%
jan 1, 1977
95.206
+0.518
0.55%
jan 1, 1978
95.476
+0.27
0.28%
jan 1, 1979
95.011
-0.466
-0.49%
jan 1, 1980
94.942
-0.069
-0.07%
jan 1, 1981
94.689
-0.252
-0.27%
jan 1, 1982
94.746
+0.057
0.06%
jan 1, 1983
94.563
-0.183
-0.19%
jan 1, 1984
94.836
+0.273
0.29%
jan 1, 1985
94.398
-0.439
-0.46%
jan 1, 1986
95.7
+1.303
1.38%
jan 1, 1987
94.972
-0.728
-0.76%
jan 1, 1988
95.58
+0.608
0.64%
jan 1, 1989
96.178
+0.598
0.63%
jan 1, 1990
96.631
+0.452
0.47%
jan 1, 1991
94.563
-2.067
-2.14%
jan 1, 1992
94.056
-0.508
-0.54%
jan 1, 1993
94.322
+0.266
0.28%
jan 1, 1994
94.161
-0.161
-0.17%
jan 1, 1995
94.27
+0.109
0.12%
jan 1, 1996
93.85
-0.42
-0.45%
jan 1, 1997
93.463
-0.387
-0.41%
jan 1, 1998
93.511
+0.048
0.05%
jan 1, 1999
94.087
+0.576
0.62%
jan 1, 2000
94.18
+0.093
0.1%
jan 1, 2001
94.591
+0.411
0.44%
jan 1, 2002
94.387
-0.204
-0.22%
jan 1, 2003
94.072
-0.316
-0.33%
jan 1, 2004
93.989
-0.082
-0.09%
jan 1, 2005
93.789
-0.2
-0.21%
jan 1, 2006
93.417
-0.372
-0.4%
jan 1, 2007
92.892
-0.524
-0.56%
jan 1, 2008
93.02
+0.128
0.14%
jan 1, 2009
92.767
-0.254
-0.27%
jan 1, 2010
92.357
-0.41
-0.44%
jan 1, 2011
90.366
-1.991
-2.16%
jan 1, 2012
90.83
+0.464
0.51%
jan 1, 2013
90.119
-0.711
-0.78%
jan 1, 2014
88.006
-2.113
-2.34%
jan 1, 2015
85.676
-2.33
-2.65%
Ranking of countries by current statistics by years


Comments: