29
/
en
AIzaSyAYiBZKx7MnpbEhh9jyipgxe19OcubqV5w
April 1, 2024
256324
Sweden
SWE
true
2
1
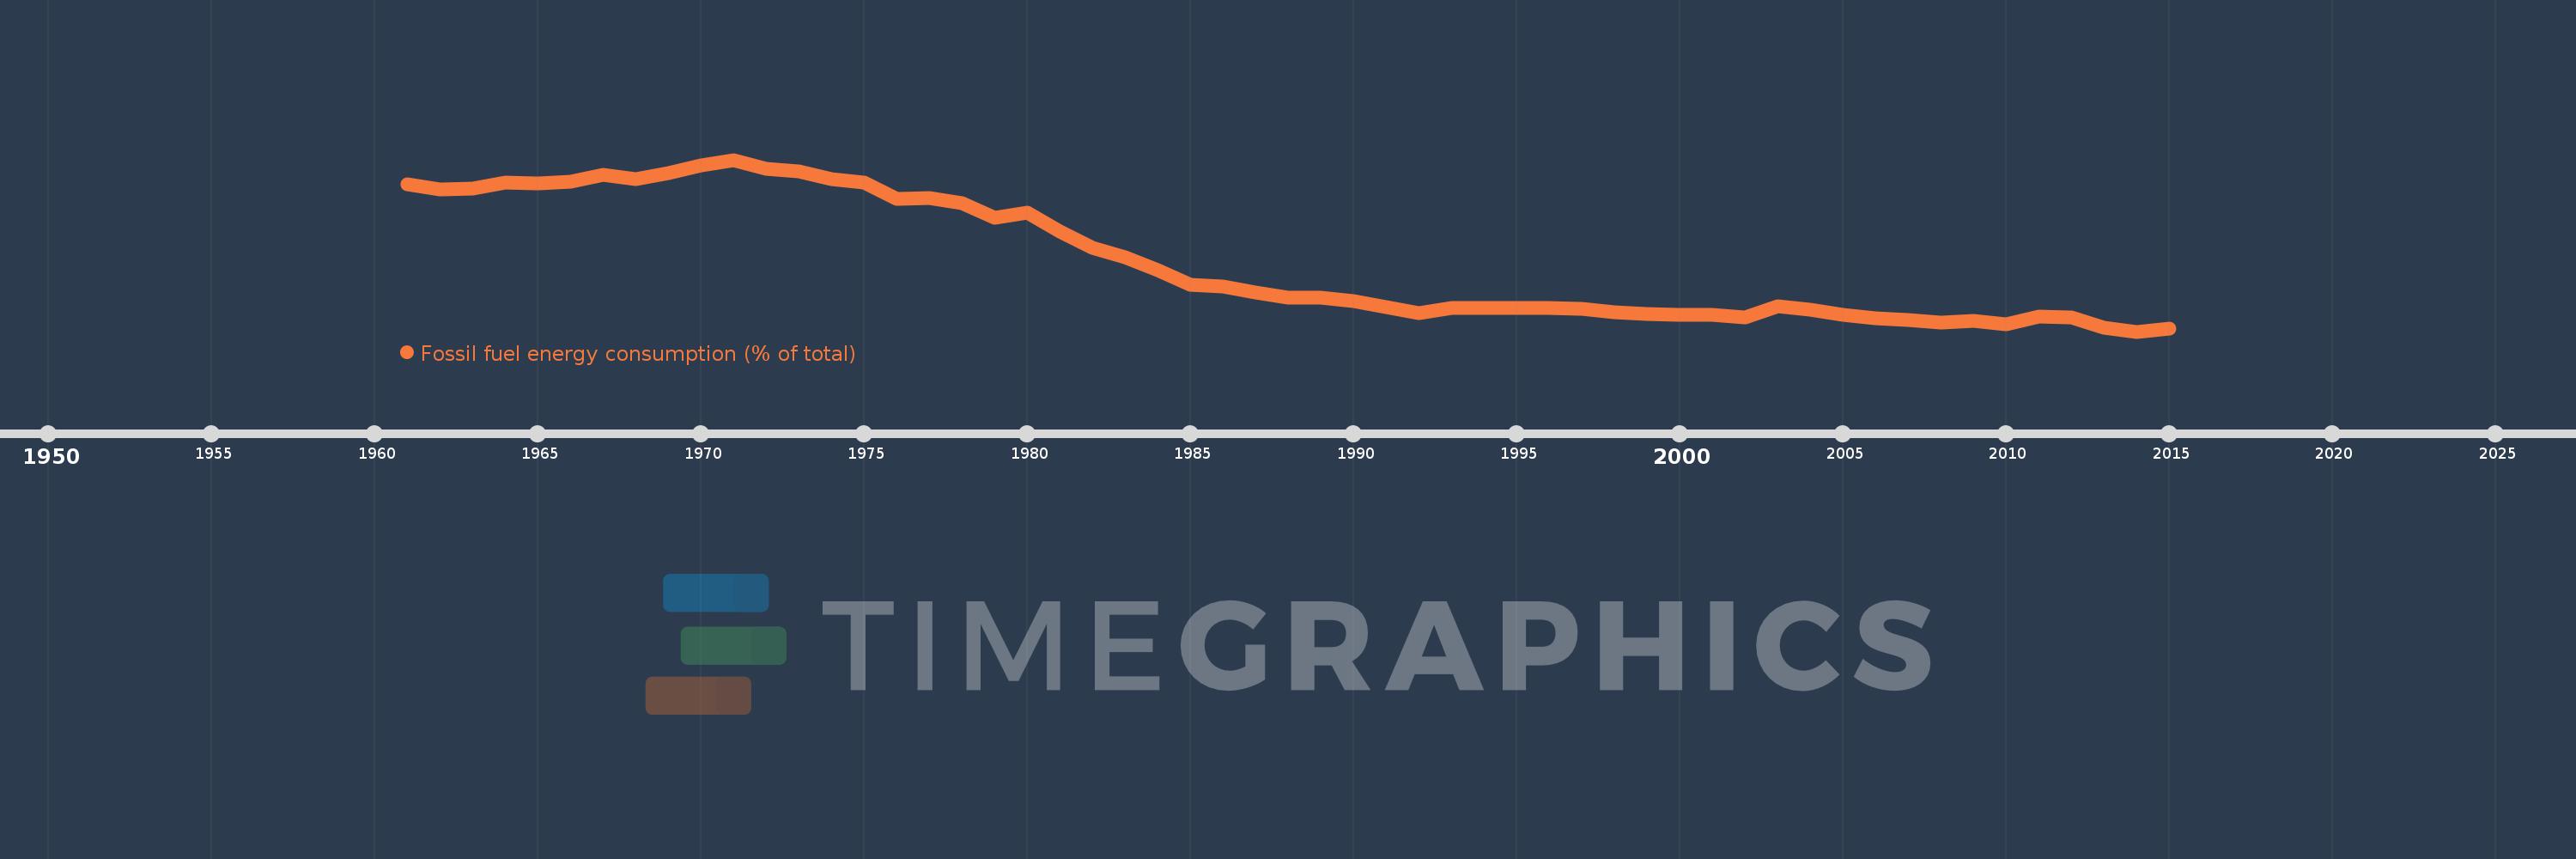
Fossil fuel energy consumption (% of total)
2015,2014,2013,2012,2011,2010,2009,2008,2007,2006,2005,2004,2003,2002,2001,2000,1999,1998,1997,1996,1995,1994,1993,1992,1991,1990,1989,1988,1987,1986,1985,1984,1983,1982,1981,1980,1979,1978,1977,1976,1975,1974,1973,1972,1971,1970,1969,1968,1967,1966,1965,1964,1963,1962,1961
This statistics in other country:
AlbaniaAlgeriaAngolaAntigua and BarbudaArab WorldArgentinaArmeniaAustraliaAustriaAzerbaijanBahamas, TheBahrainBangladeshBarbadosBelarusBelgiumBelizeBeninBhutanBoliviaBosnia and HerzegovinaBotswanaBrazilBrunei DarussalamBulgariaCabo VerdeCambodiaCameroonCanadaCaribbean small statesCentral Europe and the BalticsChileChinaColombiaComorosCongo, Dem. Rep.Congo, Rep.Costa RicaCote d'IvoireCroatiaCubaCuracaoCyprusCzech RepublicDenmarkDjiboutiDominicaDominican RepublicEarly-demographic dividendEast Asia & PacificEast Asia & Pacific (excluding high income)East Asia & Pacific (IDA & IBRD countries)EcuadorEgypt, Arab Rep.El SalvadorEquatorial GuineaEritreaEstoniaEthiopiaEuro areaEurope & Central AsiaEurope & Central Asia (excluding high income)Europe & Central Asia (IDA & IBRD countries)European UnionFijiFinlandFragile and conflict affected situationsFranceGabonGambia, TheGeorgiaGermanyGhanaGibraltarGreeceGrenadaGuatemalaGuinea-BissauGuyanaHaitiHeavily indebted poor countries (HIPC)High incomeHondurasHong Kong SAR, ChinaHungaryIBRD onlyIcelandIDA & IBRD totalIDA blendIDA onlyIDA totalIndiaIndonesiaIran, Islamic Rep.IraqIrelandIsraelItalyJamaicaJapanJordanKazakhstanKenyaKiribatiKorea, Dem. People’s Rep.Korea, Rep.KosovoKuwaitKyrgyz RepublicLate-demographic dividendLatin America & Caribbean Latin America & Caribbean (excluding high income)Latin America & the Caribbean (IDA & IBRD countries)LatviaLeast developed countries: UN classificationLebanonLesothoLibyaLithuaniaLow & middle incomeLow incomeLower middle incomeLuxembourgMacedonia, FYRMalaysiaMaldivesMaltaMarshall IslandsMauritiusMexicoMiddle East & North AfricaMiddle East & North Africa (excluding high income)Middle East & North Africa (IDA & IBRD countries)Middle incomeMoldovaMongoliaMontenegroMoroccoMozambiqueMyanmarNamibiaNepalNetherlandsNew ZealandNicaraguaNigerNigeriaNorth AmericaNorwayOECD membersOmanOther small statesPacific island small statesPakistanPalauPanamaParaguayPeruPhilippinesPolandPortugalPost-demographic dividendPre-demographic dividendQatarRomaniaRussian FederationSamoaSao Tome and PrincipeSaudi ArabiaSenegalSerbiaSeychellesSingaporeSlovak RepublicSloveniaSmall statesSolomon IslandsSouth AfricaSouth AsiaSouth Asia (IDA & IBRD)South SudanSpainSri LankaSt. Kitts and NevisSt. LuciaSt. Vincent and the GrenadinesSub-Saharan Africa Sub-Saharan Africa (excluding high income)Sub-Saharan Africa (IDA & IBRD countries)SudanSurinameSwazilandSwedenSwitzerlandSyrian Arab RepublicTajikistanTanzaniaThailandTimor-LesteTogoTongaTrinidad and TobagoTunisiaTurkeyUkraineUnited Arab EmiratesUnited KingdomUnited StatesUpper middle incomeUruguayUzbekistanVanuatuVenezuela, RBVietnamWorldYemen, Rep.ZambiaZimbabwe Timeline:
This timeline shows a graph from 1961 to 2015 of Sweden. No data until 1960. Number of actual observations by date: 55.
Source name:
World Development Indicators
Source organization:
IEA Statistics © OECD/IEA 2014 (http://www.iea.org/stats/index.asp), subject to https://www.iea.org/t&c/termsandconditions/
Categories, topics:
Energy & Mining
Last updated:
apr 23, 2017
Indicators value changes by year
Minimum:
29.811
jan 1, 2014
At the date of observation
Value
Absolute change
Change from previous value
jan 1, 1961
74.493
+74.493
0.0%
jan 1, 1962
72.753
-1.74
-2.34%
jan 1, 1963
73.226
+0.472
0.65%
jan 1, 1964
74.985
+1.759
2.4%
jan 1, 1965
74.744
-0.241
-0.32%
jan 1, 1966
75.184
+0.44
0.59%
jan 1, 1967
77.289
+2.105
2.8%
jan 1, 1968
75.935
-1.354
-1.75%
jan 1, 1969
77.817
+1.882
2.48%
jan 1, 1970
80.25
+2.433
3.13%
jan 1, 1971
81.83
+1.58
1.97%
jan 1, 1972
79.117
-2.713
-3.32%
jan 1, 1973
78.226
-0.891
-1.13%
jan 1, 1974
76.04
-2.187
-2.8%
jan 1, 1975
74.862
-1.178
-1.55%
jan 1, 1976
69.963
-4.899
-6.54%
jan 1, 1977
70.29
+0.328
0.47%
jan 1, 1978
68.795
-1.496
-2.13%
jan 1, 1979
64.374
-4.421
-6.43%
jan 1, 1980
65.891
+1.518
2.36%
jan 1, 1981
60.126
-5.766
-8.75%
jan 1, 1982
55.15
-4.976
-8.28%
jan 1, 1983
52.31
-2.84
-5.15%
jan 1, 1984
48.328
-3.982
-7.61%
jan 1, 1985
44.109
-4.22
-8.73%
jan 1, 1986
43.427
-0.682
-1.55%
jan 1, 1987
41.756
-1.671
-3.85%
jan 1, 1988
40.006
-1.749
-4.19%
jan 1, 1989
40.043
+0.036
0.09%
jan 1, 1990
39.093
-0.95
-2.37%
jan 1, 1991
37.295
-1.798
-4.6%
jan 1, 1992
35.528
-1.767
-4.74%
jan 1, 1993
36.908
+1.38
3.88%
jan 1, 1994
36.877
-0.031
-0.08%
jan 1, 1995
36.902
+0.025
0.07%
jan 1, 1996
36.853
-0.049
-0.13%
jan 1, 1997
36.716
-0.137
-0.37%
jan 1, 1998
35.637
-1.079
-2.94%
jan 1, 1999
35.047
-0.59
-1.66%
jan 1, 2000
34.85
-0.198
-0.56%
jan 1, 2001
34.829
-0.021
-0.06%
jan 1, 2002
33.988
-0.841
-2.42%
jan 1, 2003
37.446
+3.458
10.18%
jan 1, 2004
36.522
-0.924
-2.47%
jan 1, 2005
34.832
-1.69
-4.63%
jan 1, 2006
33.812
-1.021
-2.93%
jan 1, 2007
33.413
-0.399
-1.18%
jan 1, 2008
32.452
-0.96
-2.87%
jan 1, 2009
33.113
+0.66
2.03%
jan 1, 2010
31.984
-1.129
-3.41%
jan 1, 2011
34.423
+2.439
7.63%
jan 1, 2012
34.214
-0.209
-0.61%
jan 1, 2013
30.999
-3.215
-9.4%
jan 1, 2014
29.811
-1.188
-3.83%
jan 1, 2015
30.754
+0.943
3.16%
Ranking of countries by current statistics by years


Comments: