29
/
en
AIzaSyAYiBZKx7MnpbEhh9jyipgxe19OcubqV5w
April 1, 2024
235759
Senegal
SEN
true
2
1
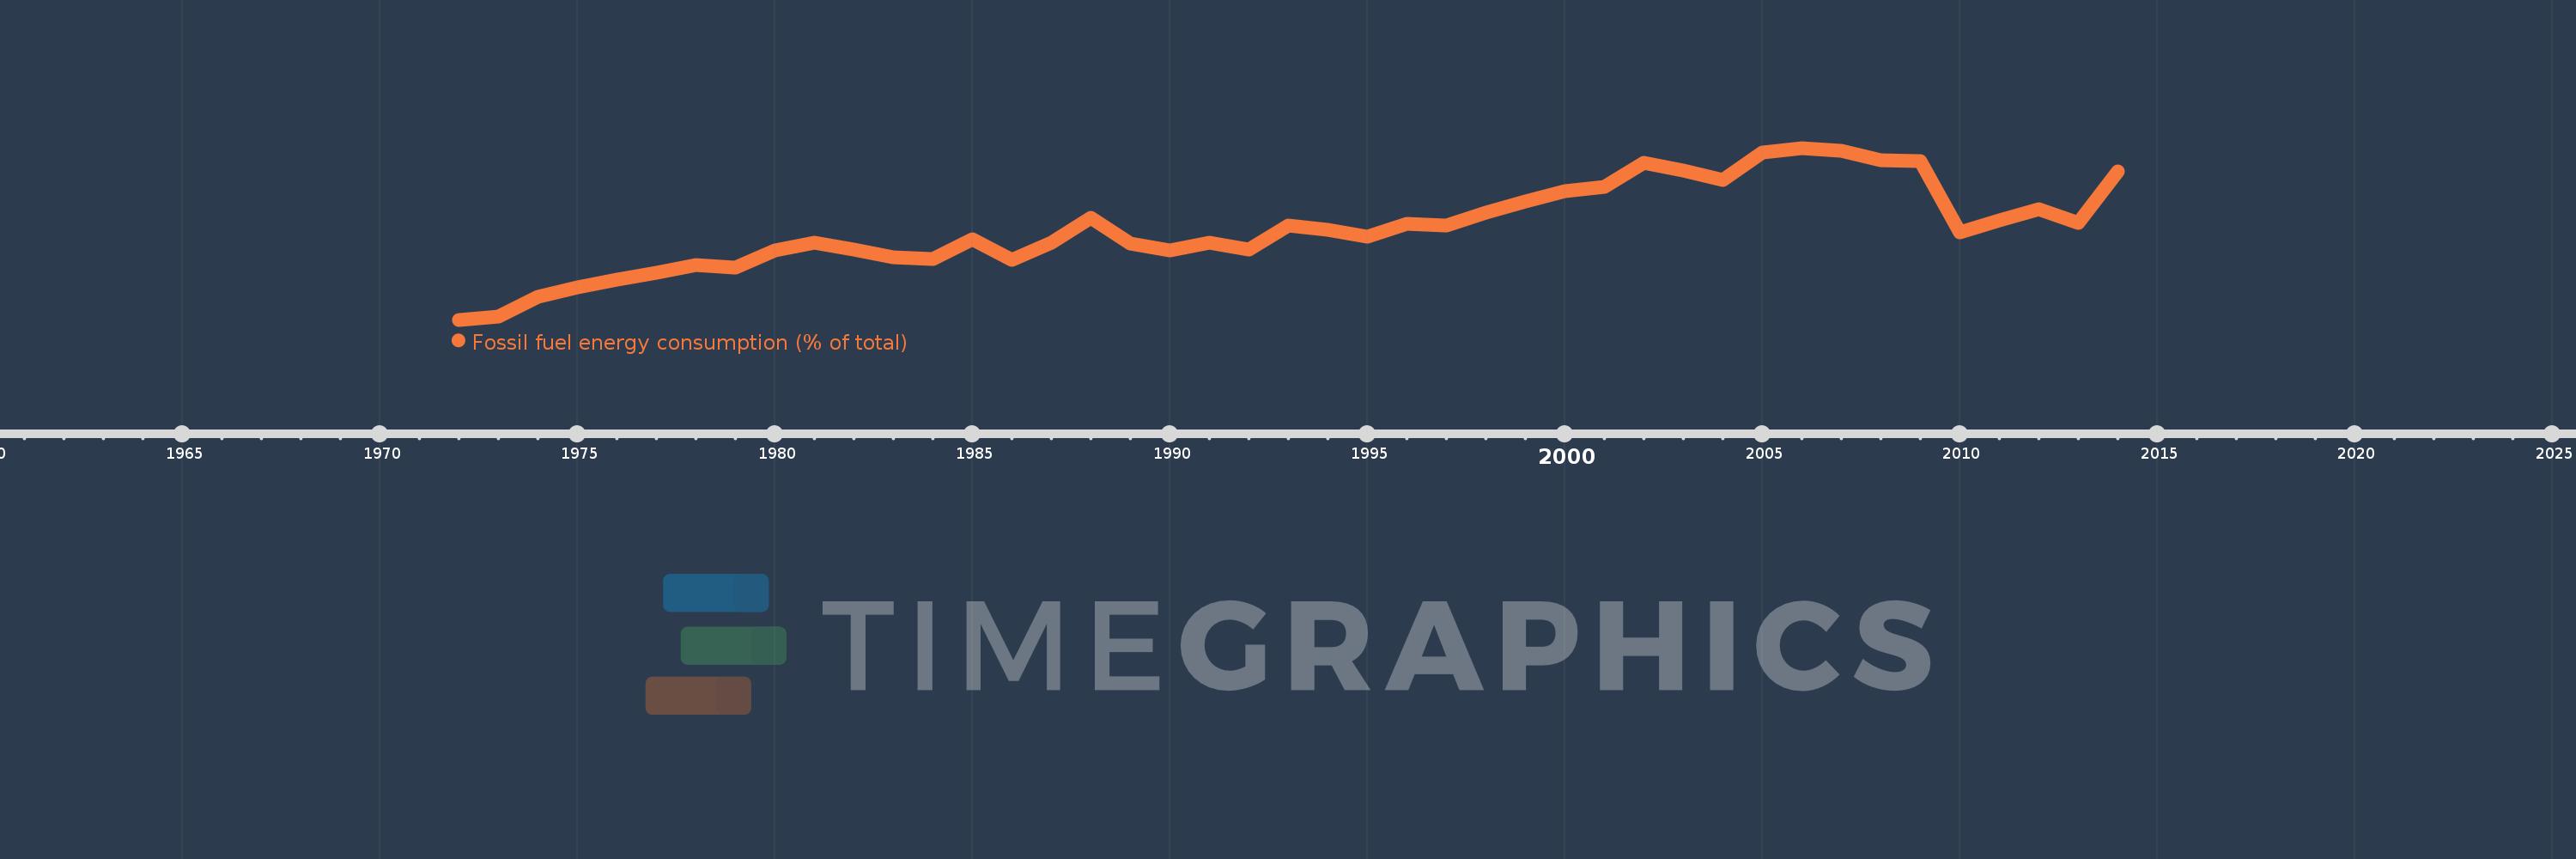
Fossil fuel energy consumption (% of total)
2014,2013,2012,2011,2010,2009,2008,2007,2006,2005,2004,2003,2002,2001,2000,1999,1998,1997,1996,1995,1994,1993,1992,1991,1990,1989,1988,1987,1986,1985,1984,1983,1982,1981,1980,1979,1978,1977,1976,1975,1974,1973,1972
This statistics in other country:
AlbaniaAlgeriaAngolaAntigua and BarbudaArab WorldArgentinaArmeniaAustraliaAustriaAzerbaijanBahamas, TheBahrainBangladeshBarbadosBelarusBelgiumBelizeBeninBhutanBoliviaBosnia and HerzegovinaBotswanaBrazilBrunei DarussalamBulgariaCabo VerdeCambodiaCameroonCanadaCaribbean small statesCentral Europe and the BalticsChileChinaColombiaComorosCongo, Dem. Rep.Congo, Rep.Costa RicaCote d'IvoireCroatiaCubaCuracaoCyprusCzech RepublicDenmarkDjiboutiDominicaDominican RepublicEarly-demographic dividendEast Asia & PacificEast Asia & Pacific (excluding high income)East Asia & Pacific (IDA & IBRD countries)EcuadorEgypt, Arab Rep.El SalvadorEquatorial GuineaEritreaEstoniaEthiopiaEuro areaEurope & Central AsiaEurope & Central Asia (excluding high income)Europe & Central Asia (IDA & IBRD countries)European UnionFijiFinlandFragile and conflict affected situationsFranceGabonGambia, TheGeorgiaGermanyGhanaGibraltarGreeceGrenadaGuatemalaGuinea-BissauGuyanaHaitiHeavily indebted poor countries (HIPC)High incomeHondurasHong Kong SAR, ChinaHungaryIBRD onlyIcelandIDA & IBRD totalIDA blendIDA onlyIDA totalIndiaIndonesiaIran, Islamic Rep.IraqIrelandIsraelItalyJamaicaJapanJordanKazakhstanKenyaKiribatiKorea, Dem. People’s Rep.Korea, Rep.KosovoKuwaitKyrgyz RepublicLate-demographic dividendLatin America & Caribbean Latin America & Caribbean (excluding high income)Latin America & the Caribbean (IDA & IBRD countries)LatviaLeast developed countries: UN classificationLebanonLesothoLibyaLithuaniaLow & middle incomeLow incomeLower middle incomeLuxembourgMacedonia, FYRMalaysiaMaldivesMaltaMarshall IslandsMauritiusMexicoMiddle East & North AfricaMiddle East & North Africa (excluding high income)Middle East & North Africa (IDA & IBRD countries)Middle incomeMoldovaMongoliaMontenegroMoroccoMozambiqueMyanmarNamibiaNepalNetherlandsNew ZealandNicaraguaNigerNigeriaNorth AmericaNorwayOECD membersOmanOther small statesPacific island small statesPakistanPalauPanamaParaguayPeruPhilippinesPolandPortugalPost-demographic dividendPre-demographic dividendQatarRomaniaRussian FederationSamoaSao Tome and PrincipeSaudi ArabiaSenegalSerbiaSeychellesSingaporeSlovak RepublicSloveniaSmall statesSolomon IslandsSouth AfricaSouth AsiaSouth Asia (IDA & IBRD)South SudanSpainSri LankaSt. Kitts and NevisSt. LuciaSt. Vincent and the GrenadinesSub-Saharan Africa Sub-Saharan Africa (excluding high income)Sub-Saharan Africa (IDA & IBRD countries)SudanSurinameSwazilandSwedenSwitzerlandSyrian Arab RepublicTajikistanTanzaniaThailandTimor-LesteTogoTongaTrinidad and TobagoTunisiaTurkeyUkraineUnited Arab EmiratesUnited KingdomUnited StatesUpper middle incomeUruguayUzbekistanVanuatuVenezuela, RBVietnamWorldYemen, Rep.ZambiaZimbabwe Timeline:
This timeline shows a graph from 1972 to 2014 of Senegal. No data until 1971. Number of actual observations by date: 43.
Source name:
World Development Indicators
Source organization:
IEA Statistics © OECD/IEA 2014 (http://www.iea.org/stats/index.asp), subject to https://www.iea.org/t&c/termsandconditions/
Categories, topics:
Energy & Mining
Last updated:
apr 23, 2017
Indicators value changes by year
Minimum:
33.562
jan 1, 1972
Maximum:
55.165
jan 1, 2006
At the date of observation
Value
Absolute change
Change from previous value
jan 1, 1972
33.562
+33.562
0.0%
jan 1, 1973
33.961
+0.399
1.19%
jan 1, 1974
36.405
+2.444
7.2%
jan 1, 1975
37.597
+1.192
3.27%
jan 1, 1976
38.566
+0.969
2.58%
jan 1, 1977
39.418
+0.852
2.21%
jan 1, 1978
40.467
+1.049
2.66%
jan 1, 1979
40.155
-0.312
-0.77%
jan 1, 1980
42.326
+2.17
5.4%
jan 1, 1981
43.259
+0.933
2.2%
jan 1, 1982
42.435
-0.824
-1.9%
jan 1, 1983
41.463
-0.972
-2.29%
jan 1, 1984
41.165
-0.298
-0.72%
jan 1, 1985
43.676
+2.511
6.1%
jan 1, 1986
41.107
-2.569
-5.88%
jan 1, 1987
43.272
+2.165
5.27%
jan 1, 1988
46.347
+3.074
7.1%
jan 1, 1989
43.121
-3.226
-6.96%
jan 1, 1990
42.299
-0.822
-1.91%
jan 1, 1991
43.257
+0.957
2.26%
jan 1, 1992
42.387
-0.87
-2.01%
jan 1, 1993
45.405
+3.019
7.12%
jan 1, 1994
44.839
-0.566
-1.25%
jan 1, 1995
44.03
-0.809
-1.8%
jan 1, 1996
45.649
+1.619
3.68%
jan 1, 1997
45.423
-0.225
-0.49%
jan 1, 1998
47.069
+1.645
3.62%
jan 1, 1999
48.449
+1.38
2.93%
jan 1, 2000
49.714
+1.265
2.61%
jan 1, 2001
50.302
+0.588
1.18%
jan 1, 2002
53.257
+2.955
5.87%
jan 1, 2003
52.274
-0.983
-1.85%
jan 1, 2004
51.187
-1.087
-2.08%
jan 1, 2005
54.573
+3.386
6.61%
jan 1, 2006
55.165
+0.592
1.08%
jan 1, 2007
54.764
-0.4
-0.73%
jan 1, 2008
53.613
-1.151
-2.1%
jan 1, 2009
53.479
-0.134
-0.25%
jan 1, 2010
44.524
-8.955
-16.75%
jan 1, 2011
46.081
+1.557
3.5%
jan 1, 2012
47.497
+1.417
3.07%
jan 1, 2013
45.774
-1.724
-3.63%
jan 1, 2014
52.173
+6.399
13.98%
Ranking of countries by current statistics by years


Comments: