29
/
en
AIzaSyAYiBZKx7MnpbEhh9jyipgxe19OcubqV5w
April 1, 2024
29852
Euro area
EMU
false
2
1
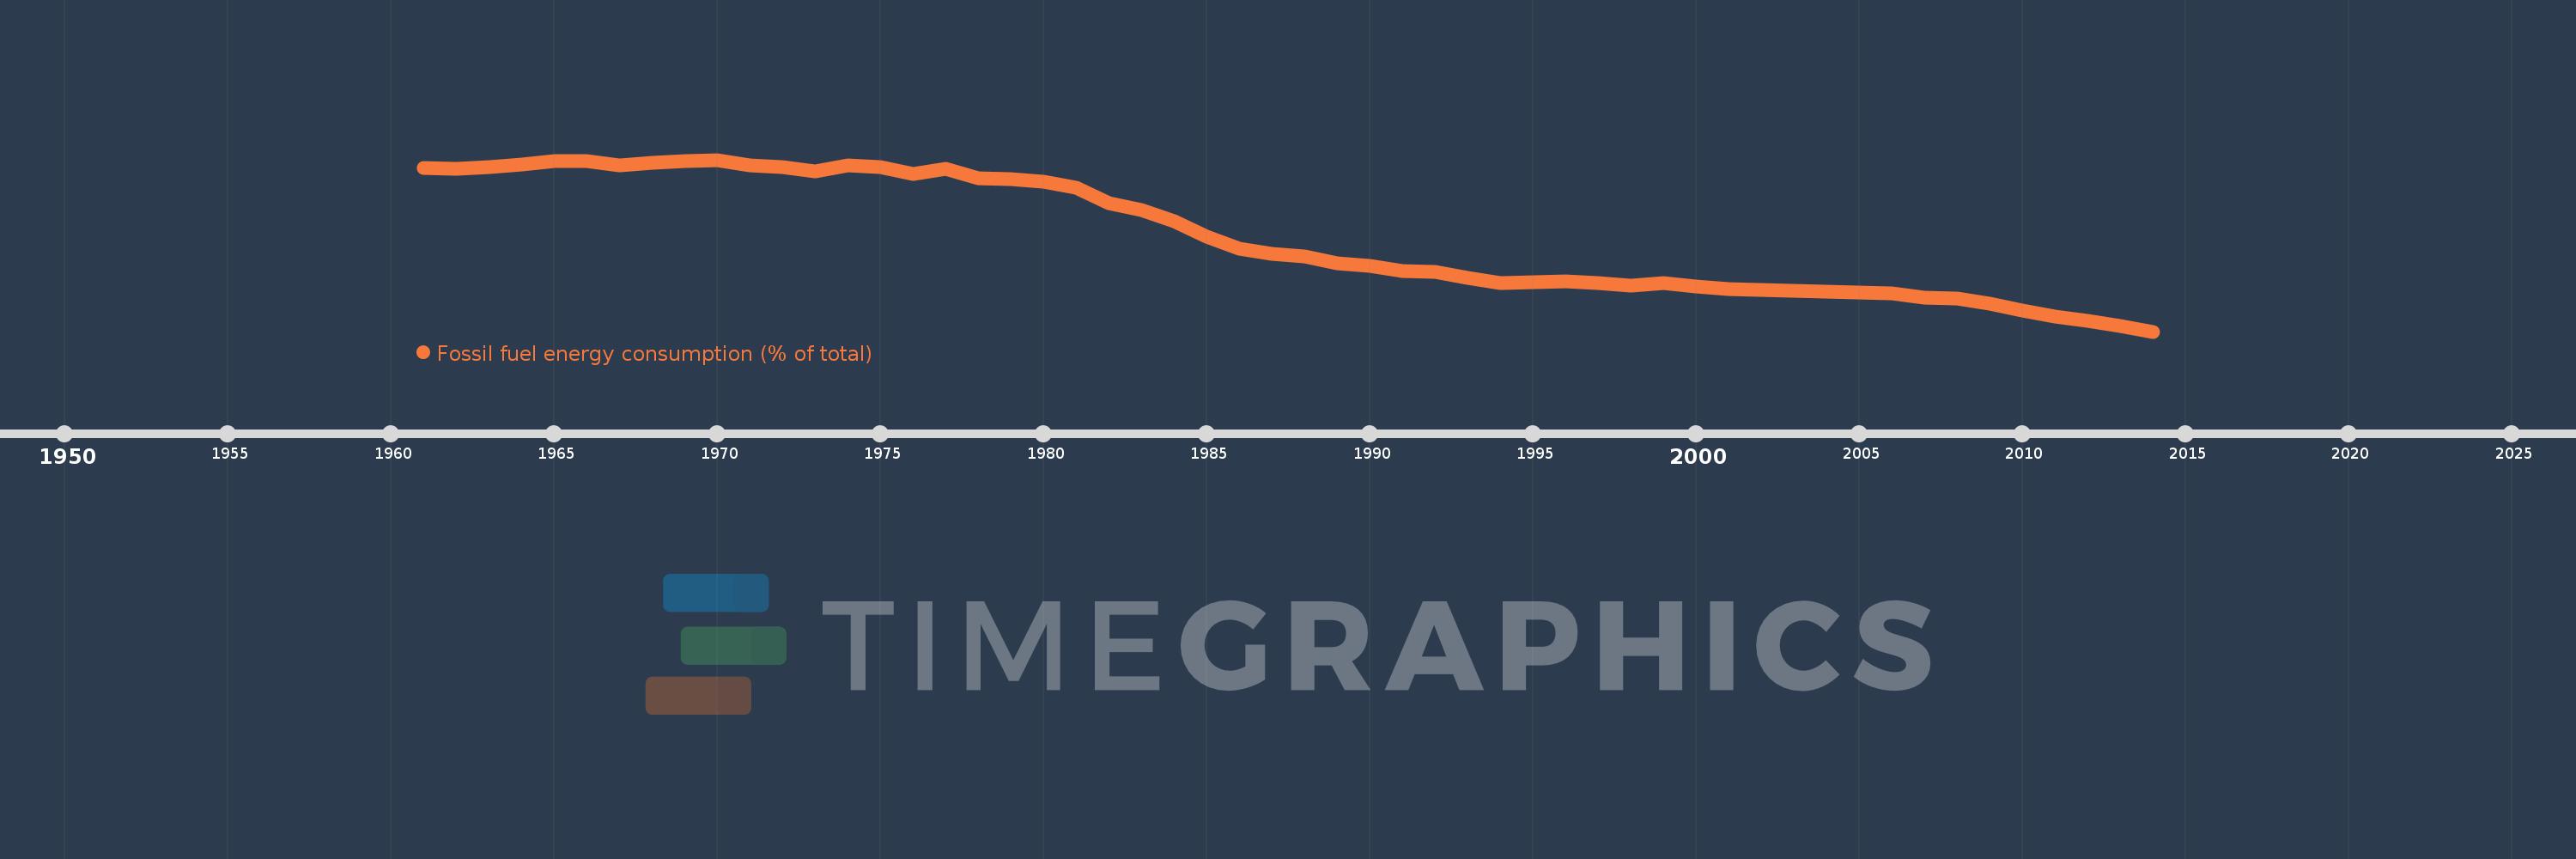
Fossil fuel energy consumption (% of total)
2014,2013,2012,2011,2010,2009,2008,2007,2006,2005,2004,2003,2002,2001,2000,1999,1998,1997,1996,1995,1994,1993,1992,1991,1990,1989,1988,1987,1986,1985,1984,1983,1982,1981,1980,1979,1978,1977,1976,1975,1974,1973,1972,1971,1970,1969,1968,1967,1966,1965,1964,1963,1962,1961
This statistics in other country:
AlbaniaAlgeriaAngolaAntigua and BarbudaArab WorldArgentinaArmeniaAustraliaAustriaAzerbaijanBahamas, TheBahrainBangladeshBarbadosBelarusBelgiumBelizeBeninBhutanBoliviaBosnia and HerzegovinaBotswanaBrazilBrunei DarussalamBulgariaCabo VerdeCambodiaCameroonCanadaCaribbean small statesCentral Europe and the BalticsChileChinaColombiaComorosCongo, Dem. Rep.Congo, Rep.Costa RicaCote d'IvoireCroatiaCubaCuracaoCyprusCzech RepublicDenmarkDjiboutiDominicaDominican RepublicEarly-demographic dividendEast Asia & PacificEast Asia & Pacific (excluding high income)East Asia & Pacific (IDA & IBRD countries)EcuadorEgypt, Arab Rep.El SalvadorEquatorial GuineaEritreaEstoniaEthiopiaEuro areaEurope & Central AsiaEurope & Central Asia (excluding high income)Europe & Central Asia (IDA & IBRD countries)European UnionFijiFinlandFragile and conflict affected situationsFranceGabonGambia, TheGeorgiaGermanyGhanaGibraltarGreeceGrenadaGuatemalaGuinea-BissauGuyanaHaitiHeavily indebted poor countries (HIPC)High incomeHondurasHong Kong SAR, ChinaHungaryIBRD onlyIcelandIDA & IBRD totalIDA blendIDA onlyIDA totalIndiaIndonesiaIran, Islamic Rep.IraqIrelandIsraelItalyJamaicaJapanJordanKazakhstanKenyaKiribatiKorea, Dem. People’s Rep.Korea, Rep.KosovoKuwaitKyrgyz RepublicLate-demographic dividendLatin America & Caribbean Latin America & Caribbean (excluding high income)Latin America & the Caribbean (IDA & IBRD countries)LatviaLeast developed countries: UN classificationLebanonLesothoLibyaLithuaniaLow & middle incomeLow incomeLower middle incomeLuxembourgMacedonia, FYRMalaysiaMaldivesMaltaMarshall IslandsMauritiusMexicoMiddle East & North AfricaMiddle East & North Africa (excluding high income)Middle East & North Africa (IDA & IBRD countries)Middle incomeMoldovaMongoliaMontenegroMoroccoMozambiqueMyanmarNamibiaNepalNetherlandsNew ZealandNicaraguaNigerNigeriaNorth AmericaNorwayOECD membersOmanOther small statesPacific island small statesPakistanPalauPanamaParaguayPeruPhilippinesPolandPortugalPost-demographic dividendPre-demographic dividendQatarRomaniaRussian FederationSamoaSao Tome and PrincipeSaudi ArabiaSenegalSerbiaSeychellesSingaporeSlovak RepublicSloveniaSmall statesSolomon IslandsSouth AfricaSouth AsiaSouth Asia (IDA & IBRD)South SudanSpainSri LankaSt. Kitts and NevisSt. LuciaSt. Vincent and the GrenadinesSub-Saharan Africa Sub-Saharan Africa (excluding high income)Sub-Saharan Africa (IDA & IBRD countries)SudanSurinameSwazilandSwedenSwitzerlandSyrian Arab RepublicTajikistanTanzaniaThailandTimor-LesteTogoTongaTrinidad and TobagoTunisiaTurkeyUkraineUnited Arab EmiratesUnited KingdomUnited StatesUpper middle incomeUruguayUzbekistanVanuatuVenezuela, RBVietnamWorldYemen, Rep.ZambiaZimbabwe Timeline:
This timeline shows a graph from 1961 to 2014 of Euro area. No data until 1960. Number of actual observations by date: 54.
Source name:
World Development Indicators
Source organization:
IEA Statistics © OECD/IEA 2014 (http://www.iea.org/stats/index.asp), subject to https://www.iea.org/t&c/termsandconditions/
Categories, topics:
Energy & Mining
Last updated:
apr 23, 2017
Indicators value changes by year
Minimum:
70.857
jan 1, 2014
Maximum:
95.172
jan 1, 1970
At the date of observation
Value
Absolute change
Change from previous value
jan 1, 1961
94.022
+94.022
0.0%
jan 1, 1962
93.952
-0.07
-0.07%
jan 1, 1963
94.145
+0.193
0.21%
jan 1, 1964
94.509
+0.364
0.39%
jan 1, 1965
95.004
+0.494
0.52%
jan 1, 1966
95.028
+0.024
0.03%
jan 1, 1967
94.345
-0.683
-0.72%
jan 1, 1968
94.701
+0.356
0.38%
jan 1, 1969
94.94
+0.238
0.25%
jan 1, 1970
95.172
+0.232
0.24%
jan 1, 1971
94.335
-0.836
-0.88%
jan 1, 1972
94.184
-0.151
-0.16%
jan 1, 1973
93.522
-0.662
-0.7%
jan 1, 1974
94.329
+0.807
0.86%
jan 1, 1975
94.112
-0.217
-0.23%
jan 1, 1976
93.225
-0.887
-0.94%
jan 1, 1977
93.887
+0.662
0.71%
jan 1, 1978
92.565
-1.322
-1.41%
jan 1, 1979
92.428
-0.137
-0.15%
jan 1, 1980
92.046
-0.382
-0.41%
jan 1, 1981
91.24
-0.807
-0.88%
jan 1, 1982
89.077
-2.163
-2.37%
jan 1, 1983
88.013
-1.064
-1.19%
jan 1, 1984
86.526
-1.487
-1.69%
jan 1, 1985
84.337
-2.189
-2.53%
jan 1, 1986
82.542
-1.795
-2.13%
jan 1, 1987
81.805
-0.737
-0.89%
jan 1, 1988
81.486
-0.319
-0.39%
jan 1, 1989
80.531
-0.954
-1.17%
jan 1, 1990
80.176
-0.355
-0.44%
jan 1, 1991
79.445
-0.731
-0.91%
jan 1, 1992
79.318
-0.127
-0.16%
jan 1, 1993
78.501
-0.818
-1.03%
jan 1, 1994
77.739
-0.762
-0.97%
jan 1, 1995
77.882
+0.144
0.18%
jan 1, 1996
78.019
+0.137
0.18%
jan 1, 1997
77.702
-0.317
-0.41%
jan 1, 1998
77.319
-0.383
-0.49%
jan 1, 1999
77.749
+0.43
0.56%
jan 1, 2000
77.296
-0.453
-0.58%
jan 1, 2001
76.816
-0.481
-0.62%
jan 1, 2002
76.746
-0.07
-0.09%
jan 1, 2003
76.635
-0.11
-0.14%
jan 1, 2004
76.536
-0.099
-0.13%
jan 1, 2005
76.339
-0.197
-0.26%
jan 1, 2006
76.217
-0.123
-0.16%
jan 1, 2007
75.662
-0.555
-0.73%
jan 1, 2008
75.502
-0.159
-0.21%
jan 1, 2009
74.776
-0.727
-0.96%
jan 1, 2010
73.819
-0.957
-1.28%
jan 1, 2011
73.024
-0.795
-1.08%
jan 1, 2012
72.375
-0.649
-0.89%
jan 1, 2013
71.635
-0.74
-1.02%
jan 1, 2014
70.857
-0.778
-1.09%
Ranking of countries by current statistics by years


Comments: