29
/
en
AIzaSyAYiBZKx7MnpbEhh9jyipgxe19OcubqV5w
April 1, 2024
201559
Morocco
MAR
true
2
1
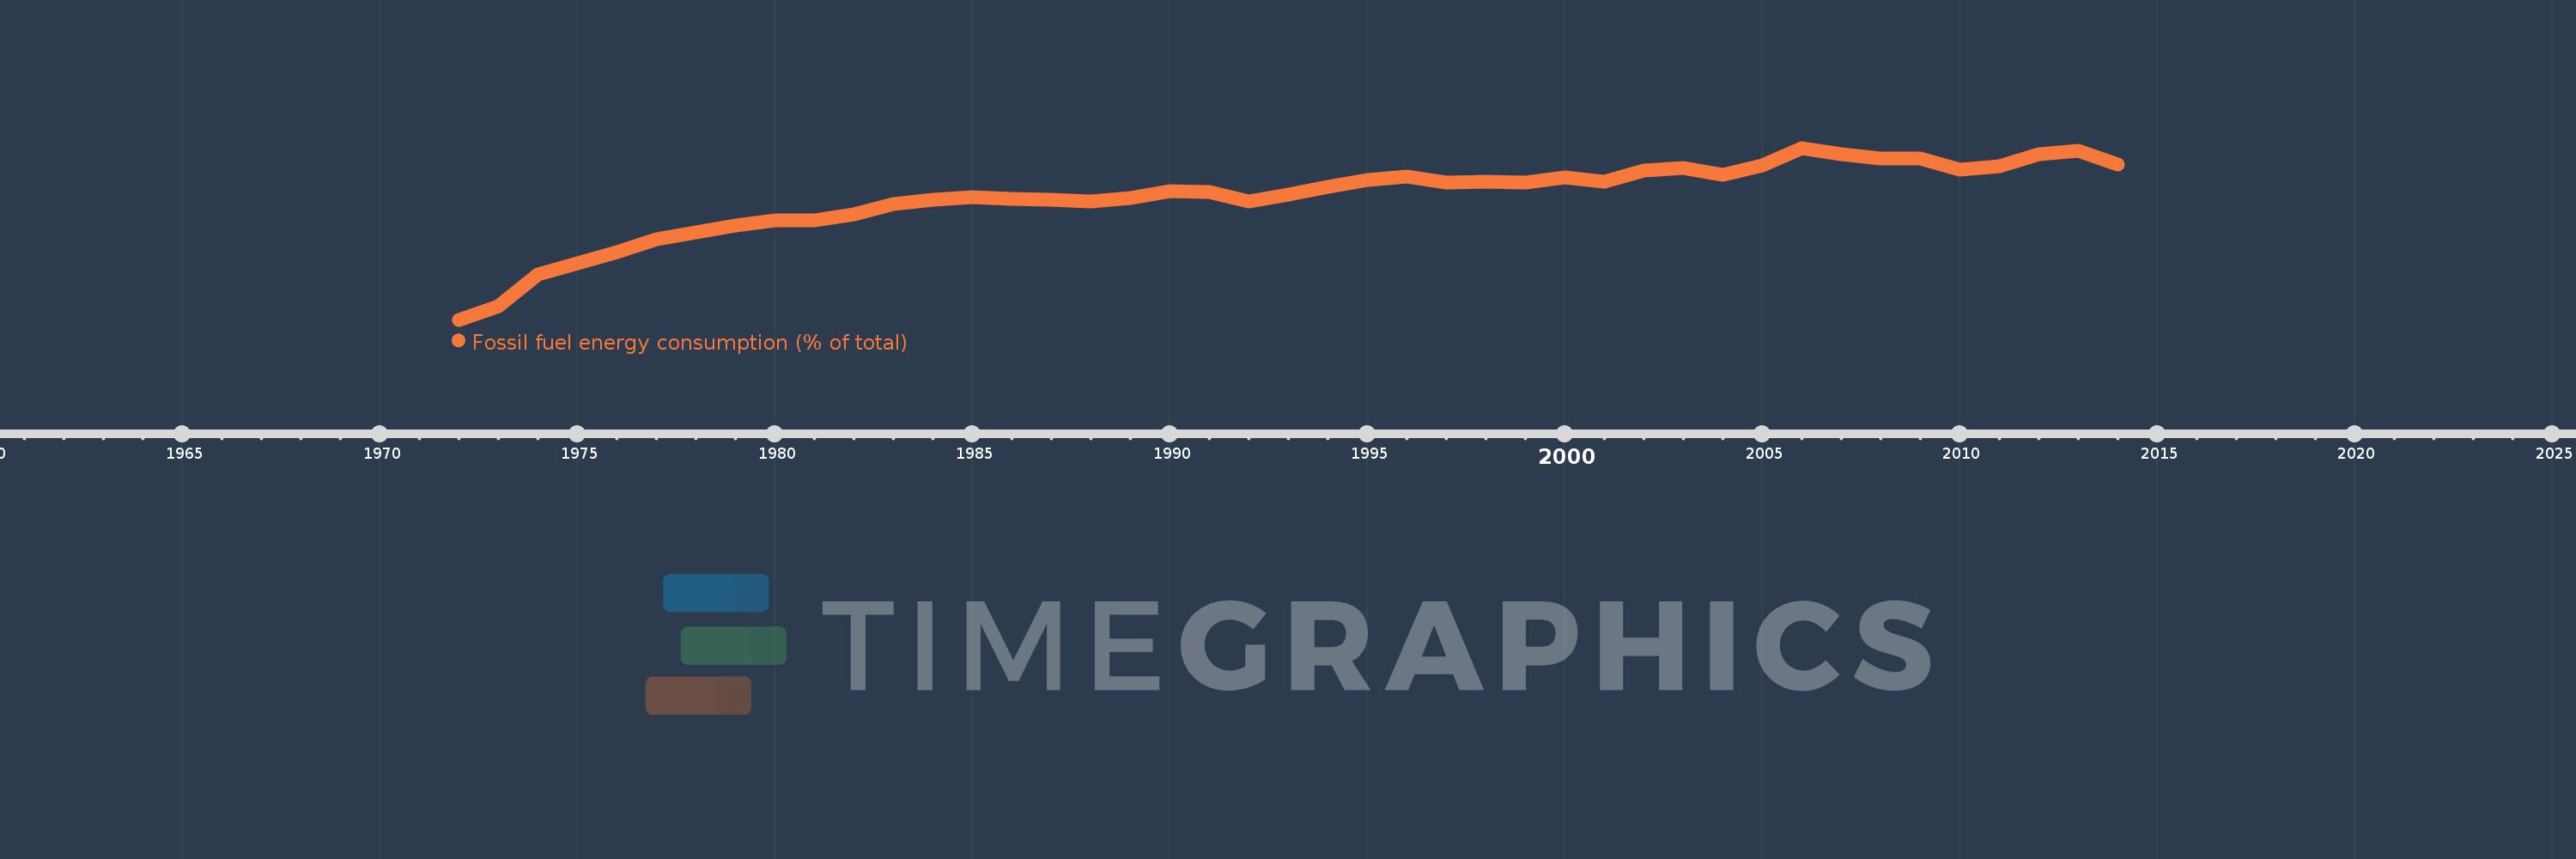
Fossil fuel energy consumption (% of total)
2014,2013,2012,2011,2010,2009,2008,2007,2006,2005,2004,2003,2002,2001,2000,1999,1998,1997,1996,1995,1994,1993,1992,1991,1990,1989,1988,1987,1986,1985,1984,1983,1982,1981,1980,1979,1978,1977,1976,1975,1974,1973,1972
This statistics in other country:
AlbaniaAlgeriaAngolaAntigua and BarbudaArab WorldArgentinaArmeniaAustraliaAustriaAzerbaijanBahamas, TheBahrainBangladeshBarbadosBelarusBelgiumBelizeBeninBhutanBoliviaBosnia and HerzegovinaBotswanaBrazilBrunei DarussalamBulgariaCabo VerdeCambodiaCameroonCanadaCaribbean small statesCentral Europe and the BalticsChileChinaColombiaComorosCongo, Dem. Rep.Congo, Rep.Costa RicaCote d'IvoireCroatiaCubaCuracaoCyprusCzech RepublicDenmarkDjiboutiDominicaDominican RepublicEarly-demographic dividendEast Asia & PacificEast Asia & Pacific (excluding high income)East Asia & Pacific (IDA & IBRD countries)EcuadorEgypt, Arab Rep.El SalvadorEquatorial GuineaEritreaEstoniaEthiopiaEuro areaEurope & Central AsiaEurope & Central Asia (excluding high income)Europe & Central Asia (IDA & IBRD countries)European UnionFijiFinlandFragile and conflict affected situationsFranceGabonGambia, TheGeorgiaGermanyGhanaGibraltarGreeceGrenadaGuatemalaGuinea-BissauGuyanaHaitiHeavily indebted poor countries (HIPC)High incomeHondurasHong Kong SAR, ChinaHungaryIBRD onlyIcelandIDA & IBRD totalIDA blendIDA onlyIDA totalIndiaIndonesiaIran, Islamic Rep.IraqIrelandIsraelItalyJamaicaJapanJordanKazakhstanKenyaKiribatiKorea, Dem. People’s Rep.Korea, Rep.KosovoKuwaitKyrgyz RepublicLate-demographic dividendLatin America & Caribbean Latin America & Caribbean (excluding high income)Latin America & the Caribbean (IDA & IBRD countries)LatviaLeast developed countries: UN classificationLebanonLesothoLibyaLithuaniaLow & middle incomeLow incomeLower middle incomeLuxembourgMacedonia, FYRMalaysiaMaldivesMaltaMarshall IslandsMauritiusMexicoMiddle East & North AfricaMiddle East & North Africa (excluding high income)Middle East & North Africa (IDA & IBRD countries)Middle incomeMoldovaMongoliaMontenegroMoroccoMozambiqueMyanmarNamibiaNepalNetherlandsNew ZealandNicaraguaNigerNigeriaNorth AmericaNorwayOECD membersOmanOther small statesPacific island small statesPakistanPalauPanamaParaguayPeruPhilippinesPolandPortugalPost-demographic dividendPre-demographic dividendQatarRomaniaRussian FederationSamoaSao Tome and PrincipeSaudi ArabiaSenegalSerbiaSeychellesSingaporeSlovak RepublicSloveniaSmall statesSolomon IslandsSouth AfricaSouth AsiaSouth Asia (IDA & IBRD)South SudanSpainSri LankaSt. Kitts and NevisSt. LuciaSt. Vincent and the GrenadinesSub-Saharan Africa Sub-Saharan Africa (excluding high income)Sub-Saharan Africa (IDA & IBRD countries)SudanSurinameSwazilandSwedenSwitzerlandSyrian Arab RepublicTajikistanTanzaniaThailandTimor-LesteTogoTongaTrinidad and TobagoTunisiaTurkeyUkraineUnited Arab EmiratesUnited KingdomUnited StatesUpper middle incomeUruguayUzbekistanVanuatuVenezuela, RBVietnamWorldYemen, Rep.ZambiaZimbabwe Timeline:
This timeline shows a graph from 1972 to 2014 of Morocco. No data until 1971. Number of actual observations by date: 43.
Source name:
World Development Indicators
Source organization:
IEA Statistics © OECD/IEA 2014 (http://www.iea.org/stats/index.asp), subject to https://www.iea.org/t&c/termsandconditions/
Categories, topics:
Energy & Mining
Last updated:
apr 23, 2017
Indicators value changes by year
Minimum:
73.401
jan 1, 1972
Maximum:
89.659
jan 1, 2006
At the date of observation
Value
Absolute change
Change from previous value
jan 1, 1972
73.401
+73.401
0.0%
jan 1, 1973
74.66
+1.258
1.71%
jan 1, 1974
77.71
+3.05
4.09%
jan 1, 1975
78.748
+1.038
1.34%
jan 1, 1976
79.826
+1.078
1.37%
jan 1, 1977
81.009
+1.182
1.48%
jan 1, 1978
81.676
+0.668
0.82%
jan 1, 1979
82.284
+0.608
0.74%
jan 1, 1980
82.8
+0.516
0.63%
jan 1, 1981
82.846
+0.045
0.05%
jan 1, 1982
83.354
+0.509
0.61%
jan 1, 1983
84.313
+0.959
1.15%
jan 1, 1984
84.718
+0.405
0.48%
jan 1, 1985
85.02
+0.302
0.36%
jan 1, 1986
84.818
-0.202
-0.24%
jan 1, 1987
84.731
-0.087
-0.1%
jan 1, 1988
84.579
-0.152
-0.18%
jan 1, 1989
84.898
+0.319
0.38%
jan 1, 1990
85.592
+0.694
0.82%
jan 1, 1991
85.453
-0.139
-0.16%
jan 1, 1992
84.565
-0.888
-1.04%
jan 1, 1993
85.242
+0.677
0.8%
jan 1, 1994
86.012
+0.77
0.9%
jan 1, 1995
86.652
+0.64
0.74%
jan 1, 1996
86.991
+0.339
0.39%
jan 1, 1997
86.345
-0.647
-0.74%
jan 1, 1998
86.486
+0.141
0.16%
jan 1, 1999
86.347
-0.139
-0.16%
jan 1, 2000
86.906
+0.559
0.65%
jan 1, 2001
86.479
-0.427
-0.49%
jan 1, 2002
87.495
+1.016
1.17%
jan 1, 2003
87.725
+0.23
0.26%
jan 1, 2004
87.091
-0.633
-0.72%
jan 1, 2005
87.985
+0.893
1.03%
jan 1, 2006
89.659
+1.674
1.9%
jan 1, 2007
89.062
-0.598
-0.67%
jan 1, 2008
88.677
-0.384
-0.43%
jan 1, 2009
88.643
-0.035
-0.04%
jan 1, 2010
87.613
-1.03
-1.16%
jan 1, 2011
87.929
+0.315
0.36%
jan 1, 2012
89.057
+1.128
1.28%
jan 1, 2013
89.363
+0.306
0.34%
jan 1, 2014
88.105
-1.258
-1.41%
Ranking of countries by current statistics by years


Comments: